
College Sonar
Compare collegesHow it worksFor colleges

Loading

Explore

Look up a collegeDegrees near youCompare collegesTop degrees by stateWhat colleges are like

Understand

How it worksHow badges are awarded

About

For collegesContact us

College Sonar by Optivara © 2026

University of Illinois Urbana-Champaign

Champaign, IL

Photo: Beyond My Ken · CC BY-SA 4.0

Competitive · 61 of 71 programs pay back

38,358 undergraduates, 20 students for every faculty member · Division I-FBS athletics · Graduate students are 36% of total enrollment

What this college is like

Best Financial Gain

Estimated over 20 years

$1.63M

Computer Science

Worst Financial Gain

Estimated over 20 years

-$234k

Philosophy

Customize by family incomeUnder $30k$30k to $48k$48k to $75k$75k to $110kOver $110k
Program20 yr Financial Gain
  1. 1Computer Science$181,981 annual earnings 4 years after graduation, a median across 193 graduates$1.63M
  2. 2Computer Engineering$159,855 annual earnings 4 years after graduation, a median across 210 graduates$1.35M
  3. 3Mathematics and Computer Science$155,503 annual earnings 4 years after graduation, a median across 37 graduates$1.30M
  4. 4Computer and Information Sciences General$146,946 annual earnings 4 years after graduation, a median across 23 graduates$1.19M
  5. 5Finance and Financial Management Services$119,978 annual earnings 4 years after graduation, a median across 192 graduates$849k
  6. 6Management Information Systems and Services$116,339 annual earnings 4 years after graduation, a median across 129 graduates$803k
  7. 7Nuclear Engineering$116,047 annual earnings 4 years after graduation, a median across 29 graduates$799k
  8. 8Electrical Electronics and Communications Engineering$111,783 annual earnings 4 years after graduation, a median across 135 graduates$745k
  9. 9Business Administration Management and Operations$107,904 annual earnings 4 years after graduation, a median across 133 graduates$696k
  10. 10Systems Engineering$106,805 annual earnings 4 years after graduation, a median across 40 graduates$682k
View all 71 programs →
  1. 11Statistics$105,978 annual earnings 4 years after graduation, a median across 108 graduates$672k
  2. 12Chemical Engineering$104,317 annual earnings 4 years after graduation, a median across 135 graduates$651k
  3. 13Management Sciences and Quantitative Methods$104,172 annual earnings 4 years after graduation, a median across 55 graduates$649k
  4. 14Industrial Engineering$103,143 annual earnings 4 years after graduation, a median across 42 graduates$636k
  5. 15Engineering Physics$102,211 annual earnings 4 years after graduation, a median across 44 graduates$624k
  6. 16Accounting and Related Services$101,098 annual earnings 4 years after graduation, a median across 273 graduates$610k
  7. 17Biomedical/Medical Engineering$97,926 annual earnings 4 years after graduation, a median across 25 graduates$570k
  8. 18Materials Engineering$97,924 annual earnings 4 years after graduation, a median across 53 graduates$570k
  9. 19Aerospace Aeronautical and Astronautical/Space Engineering$97,276 annual earnings 4 years after graduation, a median across 80 graduates$562k
  10. 20Mechanical Engineering$95,329 annual earnings 4 years after graduation, a median across 134 graduates$537k
  11. 21Civil Engineering$91,650 annual earnings 4 years after graduation, a median across 142 graduates$490k
  12. 22Marketing$90,744 annual earnings 4 years after graduation, a median across 147 graduates$479k
  13. 23Engineering Mechanics$89,617 annual earnings 4 years after graduation, a median across 20 graduates$465k
  14. 24Agricultural Engineering$89,400 annual earnings 4 years after graduation, a median across 122 graduates$462k
  15. 25Economics$86,860 annual earnings 4 years after graduation, a median across 338 graduates$430k
  16. 26Agricultural Business and Management$86,646 annual earnings 4 years after graduation, a median across 170 graduates$427k
  17. 27Public Relations Advertising and Applied Communication$83,451 annual earnings 4 years after graduation, a median across 200 graduates$387k
  18. 28Physics$81,077 annual earnings 4 years after graduation, a median across 37 graduates$357k
  19. 29Mathematics$78,891 annual earnings 4 years after graduation, a median across 57 graduates$329k
  20. 30Atmospheric Sciences and Meteorology$71,425 annual earnings 4 years after graduation, a median across 16 graduates$234k
  21. 31Cell/Cellular Biology and Anatomical Sciences$70,213 annual earnings 4 years after graduation, a median across 157 graduates$219k
  22. 32Chemistry$70,197 annual earnings 4 years after graduation, a median across 93 graduates$219k
  23. 33Political Science and Government$69,515 annual earnings 4 years after graduation, a median across 192 graduates$210k
  24. 34Health Services/Allied Health/Health Sciences General$69,195 annual earnings 4 years after graduation, a median across 49 graduates$206k
  25. 35Geological and Earth Sciences/Geosciences$68,201 annual earnings 4 years after graduation, a median across 23 graduates$193k
  26. 36Sports Kinesiology and Physical Education/Fitness$67,782 annual earnings 4 years after graduation, a median across 150 graduates$188k
  27. 37Journalism$67,539 annual earnings 4 years after graduation, a median across 63 graduates$185k
  28. 38International/Globalization Studies$67,396 annual earnings 4 years after graduation, a median across 36 graduates$183k
  29. 39Architectural Sciences and Technology$67,147 annual earnings 4 years after graduation, a median across 68 graduates$180k
  30. 40Communication and Media Studies$66,439 annual earnings 4 years after graduation, a median across 292 graduates$171k
  31. 41Food Science and Technology$66,226 annual earnings 4 years after graduation, a median across 82 graduates$168k
  32. 42Public Health$65,978 annual earnings 4 years after graduation, a median across 187 graduates$165k
  33. 43Education General$65,864 annual earnings 4 years after graduation, a median across 18 graduates$164k
  34. 44Communication Disorders Sciences and Services$65,605 annual earnings 4 years after graduation, a median across 76 graduates$161k
  35. 45Design and Applied Arts$65,186 annual earnings 4 years after graduation, a median across 78 graduates$155k
  36. 46Sustainability Studies$63,604 annual earnings 4 years after graduation, a median across 24 graduates$135k
  37. 47Plant Sciences$63,279 annual earnings 4 years after graduation, a median across 36 graduates$131k
  38. 48Geography and Cartography$62,504 annual earnings 4 years after graduation, a median across 19 graduates$121k
  39. 49Romance Languages Literatures and Linguistics$61,801 annual earnings 4 years after graduation, a median across 59 graduates$112k
  40. 50Linguistic Comparative and Related Language Studies and Services$61,774 annual earnings 4 years after graduation, a median across 24 graduates$112k
  41. 51Parks Recreation and Leisure Studies$61,313 annual earnings 4 years after graduation, a median across 81 graduates$106k
  42. 52Special Education and Teaching$60,685 annual earnings 4 years after graduation, a median across 19 graduates$98k
  43. 53Biological and Biomedical Sciences Other$60,352 annual earnings 4 years after graduation, a median across 90 graduates$94k
  44. 54Research and Experimental Psychology$60,168 annual earnings 4 years after graduation, a median across 384 graduates$92k
  45. 55Systems Science and Theory$57,510 annual earnings 4 years after graduation, a median across 52 graduates$58k
  46. 56Social Work$56,917 annual earnings 4 years after graduation, a median across 97 graduates$51k
  47. 57Sociology$55,393 annual earnings 4 years after graduation, a median across 62 graduates$31k
  48. 58Natural Resources Conservation and Research$55,382 annual earnings 4 years after graduation, a median across 53 graduates$31k
  49. 59Teacher Education and Professional Development Specific Levels and Methods$55,105 annual earnings 4 years after graduation, a median across 86 graduates$28k
  50. 60English Language and Literature General$54,570 annual earnings 4 years after graduation, a median across 93 graduates$21k
  51. 61Area Studies$54,187 annual earnings 4 years after graduation, a median across 34 graduates$16k
  52. 62Teacher Education and Professional Development Specific Subject Areas$52,409 annual earnings 4 years after graduation, a median across 66 graduates-$6,529
  53. 63Ethnic Cultural Minority Gender and Group Studies$50,941 annual earnings 4 years after graduation, a median across 24 graduates-$25k
  54. 64Music$50,544 annual earnings 4 years after graduation, a median across 45 graduates-$30k
  55. 65Human Development Family Studies and Related Services$50,396 annual earnings 4 years after graduation, a median across 50 graduates-$32k
  56. 66Drama/Theatre Arts and Stagecraft$49,323 annual earnings 4 years after graduation, a median across 32 graduates-$46k
  57. 67Animal Sciences$48,026 annual earnings 4 years after graduation, a median across 84 graduates-$62k
  58. 68History$46,718 annual earnings 4 years after graduation, a median across 48 graduates-$79k
  59. 69Rhetoric and Composition/Writing Studies$44,004 annual earnings 4 years after graduation, a median across 30 graduates-$113k
  60. 70Anthropology$43,554 annual earnings 4 years after graduation, a median across 30 graduates-$119k
  61. 71Philosophyfails federal testIts graduates do not out-earn a typical worker aged 25 to 34 in the same state who has only a high school diploma. That is the U.S. Department of Education's earnings test, and a program that fails it did not beat not going.$34,482 annual earnings 4 years after graduation, a median across 19 graduates-$234k

This college's programs pay very differently from one another, so any single figure for the college as a whole would hide more than it shows.

Other colleges to consider

Every college here returns more than this one’s best program, within 250 miles. Nothing within 50 miles returns more, so the search was widened to 250 miles rather than showing you almost nothing.

Colleges of comparable difficulty come first here. Any that admit far fewer applicants than this one sit below them and are marked with what they admit. A more selective college is a different application, not a free upgrade, and part of why its graduates earn more is who it admitted in the first place.
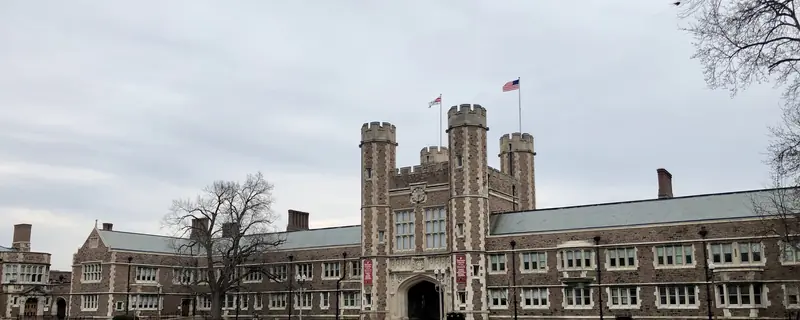
  1. 1Brookings HallWashington University in St LouisFinance and Financial Management Services · Saint Louis · 150 mi · $185,551 annual earnings 4 years after graduation, a median across 55 graduatesadmits 12%$1.87M
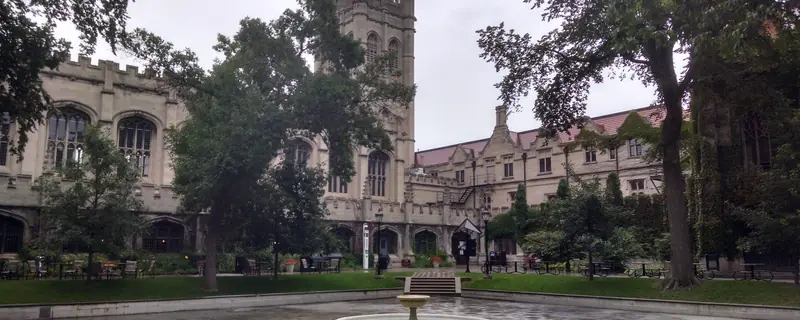
  2. 2University of Chicago main quadranglesUniversity of ChicagoComputer Science · Chicago · 121 mi · $178,068 annual earnings 4 years after graduation, a median across 32 graduatesadmits 4%$1.85M

Campus photographs: Washington University in St Louis by Doc2129 (CC BY-SA 4.0); University of Chicago by Ndshankar (CC BY-SA 4.0)

The same programs elsewhere

Holding the subject fixed and changing the college, for this college’s three strongest programs. The list above compares whole colleges at their best; this one answers the narrower question a student who already knows their subject is actually asking.

Computer Science18 colleges pay more
  1. 1University of Chicago main quadranglesUniversity of ChicagoChicago · 121 mi · $178,068 annual earnings 4 years after graduation, a median across 32 graduatesadmits under 40%$1.85M
  2. 2Brookings HallWashington University in St LouisSaint Louis · 150 mi · $177,066 annual earnings 4 years after graduation, a median across 63 graduatesadmits under 40%$1.75M

Campus photographs: University of Chicago by Ndshankar (CC BY-SA 4.0); Washington University in St Louis by Doc2129 (CC BY-SA 4.0)
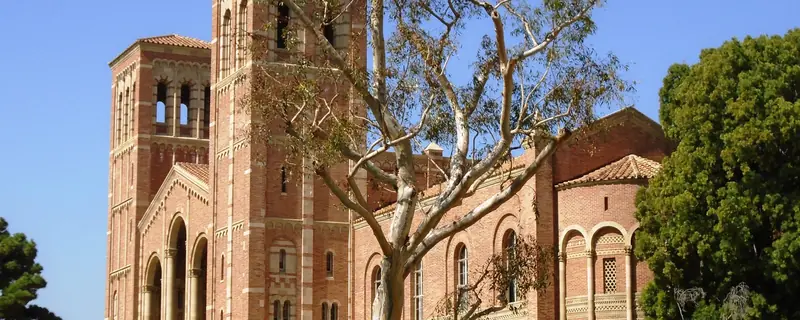
Computer Engineering7 colleges pay more, none of them nearby
  1. 12019 UCLA Royce Hall 1University of California-Los AngelesLos Angeles · 1708 mi · $228,705 annual earnings 4 years after graduation, a median across 28 graduatesadmits under 40%$2.44M

  2. 2Columbia University - Low Memorial LibraryColumbia University in the City of New YorkNew York · 751 mi · $194,365 annual earnings 4 years after graduation, a median across 18 graduatesadmits under 40%$2.10M
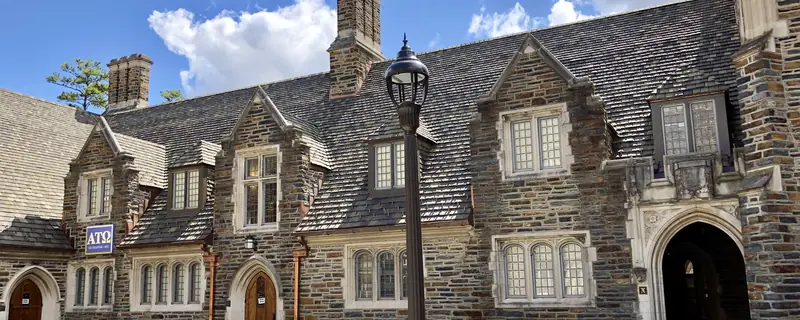
  3. 3Craven Quad, West Campus, Duke University, Durham, NCDuke UniversityDurham · 579 mi · $174,522 annual earnings 4 years after graduation, a median across 73 graduatesadmits under 40%$1.80M

Campus photographs: University of California-Los Angeles by Beyond My Ken (CC BY-SA 4.0); Columbia University in the City of New York by Ajay Suresh (CC BY 2.0); Duke University by Warren LeMay (CC0)

What this college is like

Measured from federal filings, not from a survey. Each figure is compared against four-year colleges, because medians differ too much between sectors for a national comparison to describe anything but the sector.

Teaching
Students per instructor?
20:1
▼more students per instructor than 90% of four-year colleges
Staying and finishing
Come back after year one?
95%
▲higher than 95% of four-year colleges
Finish their credential?
73.5%
▲higher than 92% of four-year colleges
Cost and aid
Yearly cost, family under $30,000?
$5,651
▲cheaper than 92% of four-year colleges
Get a grant from the college?
49%
▼a lower share than 85% of four-year colleges
Receive a Pell Grant?
24%
a lower share than 80% of four-year colleges
The campus
Undergraduates?
38,358
larger than 99% of four-year colleges
Beds per 100 undergraduates?
41
fewer than 68% of four-year colleges
Study fully online?
1.2%
fewer than 67% of four-year colleges
Graduate students, share of enrollment?
36.3%
more than 86% of four-year colleges
Play a varsity sport?
1.3%
fewer than 99% of four-year colleges
Who else is there
Mix of student backgrounds?
76 of 100
more varied than 91% of four-year colleges
Choice of subject
Broad subject areas awarded?
27
▲more than 96% of four-year colleges
Also on record
Women and men
48% / 52%
reported, not ranked
Setting
City
reported, not ranked
On-campus housing
Yes
residential
Athletic division
NCAA Division I-FBS
reported, not ranked

Compare every college in this metro

What students are saying

Students and recent alumni of University of Illinois Urbana-Champaign, in their own words, on Reddit. Every quotation links to the thread it came from.

What came up most

several threads · August to October 2026
PositiveStudent social life, making friends, and campus jobs were discussed mostly positively.
UIUC has one of the biggest student populations in the US so you will definitely find someone you vibe with. there's literally 1000s of RSOs you can join and there's a good night life (if you're into that) and its pretty lively.
r/UIUC
MixedThe value of UIUC programs for career outcomes was discussed with both pride and skepticism.
I’ve definitely gotten a lot of looks for being a UIUC grad, and even had at least one interviewer go to bat for me because he was an alum himself. I’m glad to be an UIUC alum, and I do well for myself, but it’s not like I’m having sweetheart job offers at high paying companies filling up my inbox.
r/UIUC
NegativeSome discussion criticized local student-housing landlords and tenant safety.
Landlords are so used to oppress students and ignore their safety, “flea man’s” case is just an extreme one.
r/UIUC

What students criticized

several threads · November to October 2026
NegativeStudents criticized unequal and inadequate heat protections in non-air-conditioned university residence halls.
The issue is what happens when prolonged heat makes the rooms extremely difficult to sleep in.
r/UIUC
NegativeStudents complained that the university housing queue and temporary-housing process was recurring, overcrowded, and poorly managed.
This is getting ridiculous. Whoever is/are in charge of this process needs to be removed. Students shouldn’t accept this as the norm.
r/UIUC
NegativeStudents criticized local landlords and leasing companies for poor treatment and weak tenant protections.
This really showed me that landlords were so used to oppress students because they know students are afraid to speak up and immediately go quiet when people speak up together.
r/UIUC
NegativeStudents complained about sharply rising campus-area rents without corresponding improvements to apartments.
my apartment has increased by $400 in rent in just a few years and it’s ridiculous since nothing has upgraded and there’s not even an elevator
r/UIUC
NegativeStudents criticized university meal plans as expensive, wasteful, and poor value relative to cooking for themselves.
If you want to save money, forget the meal plan. It is expensive, wasteful, and far lower in quality than what you can do yourself.
r/UIUC
NegativeStudents criticized the university as excessively focused on revenue and insufficiently generous with scholarships and aid.
I hate how money hungery the university is. I've seldom met anyone who's gotten merrit scholarships and other aid from the university.
r/UIUC
NegativeStudents criticized the administration's handling of protest, fraternity sexual-assault cases, and labor conditions.
i wont forget how this university handled students exercising their free speech in protest of genocide, how theyve handled fraternity rape cases, how they’ve handled labor/workers conditions
r/UIUC
NegativeStudents criticized UIUC campus marketing for using AI-generated squirrel imagery instead of commissioning local artists.
It’s UIUC, there’s probably a hundred volunteers that would do these for cheap or something.
r/UIUC
NegativeA CS student described severe pressure and discouragement from comparing their internship search with peers landing prestigious internships.
God dam like everyone at this fucking school is interning at Meta, Databricks, Google, Jane Street, or JP Morgan Chase.
r/UIUC

Changes and news students discussed

several threads · August to October 2026
NegativeReddit users discussed the rollout and testing of a new Memorial Stadium screen, chiefly as a light-pollution problem for nearby residents.
I live a little over half a mile away and my room is genuinely fully illuminated.
r/UIUC
NegativeUsers also discussed a newly louder Memorial Stadium speaker system and its effect beyond the stadium.
The new system is significantly louder. This sucks!
r/UIUC
NegativeStudents reported disruptive weekday construction at Sherman Hall after move-in.
this construction every weekday morning is genuinely going to drive me insane!!!
r/UIUC
PositiveA student introduced a new UIUC-focused website intended to help students find available campus study or hangout spaces.
Excited to present this new website for students to easily find spaces to study or hang out based on data from UIUC course schedules, Google Maps, user check-ins, and AI predictions.
r/UIUC

Compare University of Illinois Urbana-Champaign with another college · up to four side by side, on return and on what each place is like.

22,555Average annual costAfter grants · In-state · Family income $75k–$110k
85%Finish within six years
38,358Undergraduates
42%Applicants admitted

Where students come from

  • Illinoisin state71%
  • California4%
  • New Jersey2%
  • Texas1%
  • Outside the US14%

Share of the 9,008 students who entered as first-year undergraduates in 2024. The states shown are the three largest outside Illinois, so these do not add to 100%.

At a glance
SettingCity
Undergraduates?38,358
Graduate students21,832
Accepts42%
U.S. News national?#34
Admitted students who enroll?29%
WebsiteVisit illinois.edu
AdmissionsAY2024
Applicants73,742
Admitted31,247
Enrolled9,008
SAT middle 50%?1310-1520
ACT middle 50%30-34
Test scores?considered but not required
CostAY2022
Published price, out of state?$39,192
Published price, in state?$18,060
Room and board$13,938
Full year’s cost after grants, by income, in state
Under $30k$5,651
$30k-$48k$8,821
$48k-$75k$11,677
$75k-$110k$22,555
Over $110k$28,311

These are in-state figures. A public college charges more to students from other states, and no out-of-state net price is published, so if you would not be a resident here, read the published prices above for the size of the difference.

Aid · AY2023
Average grant?$11,774 to 49%
Pell students?24%
Federal loan debt · October 2026
Students who borrow?25%
Owed at graduation?$17,750
Monthly, over 10 years?$202/mo
Owed if they leave early?$8,741
Outcomes2018 cohort
Graduate in 4 years73%
Graduate in 6 years85%
Return after year 1?95%
Students per faculty20:1
Most-awarded programs, bachelor'sAY2025
Research and Experimental Psychology547 degrees
Computer Science458 degrees
Computer Engineering458 degrees
Statistics334 degrees
Economics317 degrees
AthleticsAY2024
DivisionNCAA Division I-FBS
Athletes479
Share of undergraduates?1%
Athletic aid$15,010,418
StudentsAY2024
Women / men48% / 52%
White37%
Asian23%
International15%
Hispanic14%
Black5%
Two or more4%

Notes and sources

Total gain after 20 years is what a graduate is ahead at that point: what the degree pays above a high-school graduate in the same state, less four years of net price and the wages given up while studying, weighted by the share of students who finish. At this college that share is 85%, and it is the same for every program on this page because the federal data reports completion for the institution rather than for individual programs. Four-year and open-admission colleges are ranked separately and never pooled.

Annual earnings 4 years after graduation is the median earnings of that program’s graduates at that point, for students who received federal aid, and is published by program. There is no program-level cost anywhere in the federal data, so net price is the college’s figure applied to each program alike. That is sound for ordering programs against one another and should not be read as a precise figure for any one of them.

Cost on this page is always net price, never the published sticker price. Net price is the college’s full cost of attendance for a year, meaning tuition, required fees, books and supplies, and housing and food, with grant and scholarship aid from federal, state and institutional sources subtracted. Loans are not subtracted, because a loan is not a discount. It is an average for first-time full-time undergraduates receiving federal aid, reported by the college in the income bands shown, so it describes a typical family in that band rather than any particular one. A student living at home, paying out-of-state rates or holding an outside scholarship will not see this figure.

Federal loan debt comes from the College Scorecard and is a median among students who borrowed, not an average across everyone. A college where few students take loans can show a high figure and a small bill for most families, so the share who borrow is printed above it and neither should be read without the other. It counts federal student loans only: private loans and Parent PLUS borrowing are not in it and are not published anywhere comparable, which makes this a floor on what a family owes rather than a total. The figure for students who leave without finishing is the same loans without the degree they were taken for. Default rates are deliberately absent: federal repayment was suspended, so the published three-year rate is zero at almost every college in the country and says nothing about any of them.

Most-awarded programs are degrees conferred in AY2025, first majors only, so a double major counts once. Where two programs are within a few degrees of each other the order between them is not meaningful.

Quotations from students were found by a language model searching Reddit, and selected from threads discussing this college in the window shown beside them. Reddit only, so this is not a survey and not a representative sample: who posts and how much varies enormously by the size and type of a college, and for that reason nothing there is scored, totalled or compared between colleges. Post dates are the model’s own reckoning rather than a retrieved field, so treat them as inside the window and not as exact. Each quotation links to its thread.

What this college is like compares each measure against four-year colleges, because medians differ too much between sectors for a national comparison to describe anything but the sector. A position of “higher than 90%” means the college matches or beats nine in ten of them on that measure, which is why the measured figure is printed beside it. Six of those measures have a better end and carry a mark; the rest are positions with no better end and carry none. There is no overall score, because combining them would need weights and the weights would be our opinion rather than a measurement.

Sources. IPEDS, the Department of Education’s annual survey, except where stated. Each block in the column beside shows its own year, because the underlying files are released on different schedules and a single date across all of them would be false. Published tuition is a sticker price and is never used as a cost; net price is. Test scores are the middle 50% of enrolled students who submitted a score, not of admitted applicants, which is why they differ from the figures other guides print. Where a US News rank is shown it is the current edition, published as a fact about the college rather than an endorsement of the ranking.

The photograph at the top of this page was taken by a member of the public and published under a license that permits reuse with credit. It is not supplied by the college, is not endorsed by it, and shows one building on one day rather than the campus as a whole. We do not generate campus images or buy stock photographs of real places, because a picture of a campus that is not that campus is a lie about somewhere real. Full credit: “Foellinger Auditorium University of Illinois at Urbana-Champaign from mid-quad.jpg”, Beyond My Ken, via Wikimedia Commons. CC BY-SA 4.0. Source: https://commons.wikimedia.org/wiki/File:Foellinger_Auditorium_University_of_Illinois_at_Urbana-Champaign_from_mid-quad.jpg. License/status: https://creativecommons.org/licenses/by-sa/4.0/.

Full methodology