College Sonar
Compare collegesHow it worksFor colleges

Loading

Explore

Look up a collegeDegrees near youCompare collegesTop degrees by stateWhat colleges are like

Understand

How it worksHow badges are awarded

About

For collegesContact us

College Sonar by Optivara © 2026

University of Massachusetts-Amherst

Amherst, MA

Photo: Quintin Soloviev · CC BY 4.0

Competitive · 39 of 48 programs pay back

25,290 undergraduates, 17 students for every faculty member · Division I-FBS athletics

What this college is like

Best Financial Gain

Estimated over 20 years

$838k

Computer Science

Worst Financial Gain

Estimated over 20 years

-$306k

Anthropology

Customize by family incomeUnder $30k$30k to $48k$48k to $75k$75k to $110kOver $110k
Program20 yr Financial Gain
  1. 1Computer Science$123,519 annual earnings 4 years after graduation, a median across 188 graduates$838k
  2. 2Computer Engineering$113,083 annual earnings 4 years after graduation, a median across 60 graduates$709k
  3. 3Electrical Electronics and Communications Engineering$101,091 annual earnings 4 years after graduation, a median across 41 graduates$560k
  4. 4Accounting and Related Services$100,516 annual earnings 4 years after graduation, a median across 162 graduates$553k
  5. 5Chemical Engineering$97,990 annual earnings 4 years after graduation, a median across 88 graduates$522k
  6. 6Industrial Engineering$97,791 annual earnings 4 years after graduation, a median across 19 graduates$520k
  7. 7Mechanical Engineering$96,999 annual earnings 4 years after graduation, a median across 207 graduates$510k
  8. 8Finance and Financial Management Services$96,995 annual earnings 4 years after graduation, a median across 200 graduates$510k
  9. 9Architectural Sciences and Technology$93,156 annual earnings 4 years after graduation, a median across 113 graduates$462k
  10. 10Business Administration Management and Operations$92,623 annual earnings 4 years after graduation, a median across 176 graduates$456k
View all 48 programs →
  1. 11Registered Nursing Nursing Administration Nursing Research and Clinical Nursing$90,309 annual earnings 4 years after graduation, a median across 215 graduates$427k
  2. 12Civil Engineering$88,076 annual earnings 4 years after graduation, a median across 112 graduates$399k
  3. 13Marketing$86,299 annual earnings 4 years after graduation, a median across 119 graduates$377k
  4. 14Mathematics$83,338 annual earnings 4 years after graduation, a median across 76 graduates$341k
  5. 15Economics$80,434 annual earnings 4 years after graduation, a median across 255 graduates$305k
  6. 16Chemistry$78,373 annual earnings 4 years after graduation, a median across 17 graduates$279k
  7. 17Biochemistry Biophysics and Molecular Biology$77,853 annual earnings 4 years after graduation, a median across 67 graduates$273k
  8. 18Food Science and Technology$77,771 annual earnings 4 years after graduation, a median across 23 graduates$272k
  9. 19Physiology Pathology and Related Sciences$74,422 annual earnings 4 years after graduation, a median across 136 graduates$230k
  10. 20Liberal Arts and Sciences General Studies and Humanities$73,242 annual earnings 4 years after graduation, a median across 70 graduates$215k
  11. 21Sports Kinesiology and Physical Education/Fitness$73,238 annual earnings 4 years after graduation, a median across 125 graduates$215k
  12. 22Biology General$72,726 annual earnings 4 years after graduation, a median across 165 graduates$209k
  13. 23Physics$72,596 annual earnings 4 years after graduation, a median across 20 graduates$207k
  14. 24Hospitality Administration/Management$70,916 annual earnings 4 years after graduation, a median across 143 graduates$187k
  15. 25Non-Professional Legal Studies$69,269 annual earnings 4 years after graduation, a median across 28 graduates$166k
  16. 26Microbiological Sciences and Immunology$66,642 annual earnings 4 years after graduation, a median across 30 graduates$134k
  17. 27Applied Horticulture and Horticultural Business Services$57,093 annual earnings 4 years after graduation, a median across 27 graduates$117k
  18. 28Landscape Architecture$64,477 annual earnings 4 years after graduation, a median across 19 graduates$107k
  19. 29Public Health$63,854 annual earnings 4 years after graduation, a median across 170 graduates$99k
  20. 30Communication Disorders Sciences and Services$63,620 annual earnings 4 years after graduation, a median across 45 graduates$96k
  21. 31Multi/Interdisciplinary Studies Other$63,383 annual earnings 4 years after graduation, a median across 346 graduates$93k
  22. 32Nutrition Sciences$63,019 annual earnings 4 years after graduation, a median across 57 graduates$89k
  23. 33Communication and Media Studies$60,891 annual earnings 4 years after graduation, a median across 219 graduates$62k
  24. 34Political Science and Government$60,726 annual earnings 4 years after graduation, a median across 83 graduates$60k
  25. 35Animal Sciences$59,543 annual earnings 4 years after graduation, a median across 22 graduates$46k
  26. 36Veterinary/Animal Health Technologies/Technicians$59,298 annual earnings 4 years after graduation, a median across 34 graduates$43k
  27. 37Agriculture/Veterinary Preparatory Programs$57,461 annual earnings 4 years after graduation, a median across 25 graduates$20k
  28. 38Sociology$56,960 annual earnings 4 years after graduation, a median across 52 graduates$14k
  29. 39History$56,597 annual earnings 4 years after graduation, a median across 49 graduates$9,265
  30. 40Environmental Design$55,571 annual earnings 4 years after graduation, a median across 22 graduates-$3,444
  31. 41Natural Resources Conservation and Research$54,215 annual earnings 4 years after graduation, a median across 144 graduates-$20k
  32. 42Journalism$52,011 annual earnings 4 years after graduation, a median across 40 graduates-$48k
  33. 43Plant Sciences$51,912 annual earnings 4 years after graduation, a median across 23 graduates-$49k
  34. 44Psychology General$51,274 annual earnings 4 years after graduation, a median across 211 graduates-$57k
  35. 45English Language and Literature General$48,475 annual earnings 4 years after graduation, a median across 49 graduates-$91k
  36. 46Fine and Studio Arts$46,027 annual earnings 4 years after graduation, a median across 36 graduates-$122k
  37. 47Agricultural Production Operations$42,520 annual earnings 4 years after graduation, a median across 31 graduates-$165k
  38. 48Anthropologyfails federal testIts graduates do not out-earn a typical worker aged 25 to 34 in the same state who has only a high school diploma. That is the U.S. Department of Education's earnings test, and a program that fails it did not beat not going.$31,186 annual earnings 4 years after graduation, a median across 17 graduates-$306k
Other colleges to consider

Every college here returns more than this one’s best program, within 50 miles.

Colleges of comparable difficulty come first here. Any that admit far fewer applicants than this one sit below them and are marked with what they admit. A more selective college is a different application, not a free upgrade, and part of why its graduates earn more is who it admitted in the first place.
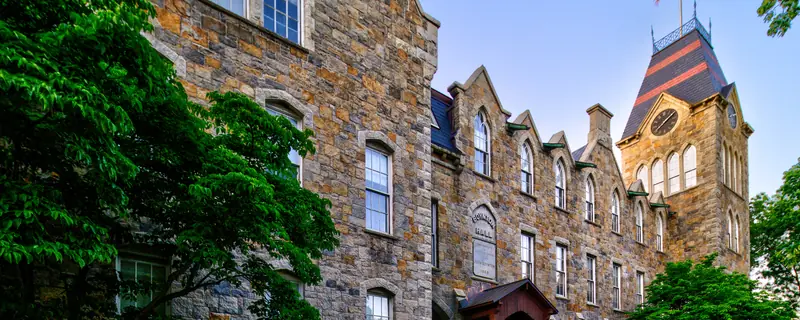
  1. 1Boynton Hall, Worcester Polytechnic InstituteWorcester Polytechnic InstituteComputer Science · Worcester · 38 mi · $134,208 annual earnings 4 years after graduation, a median across 166 graduates$1.04M
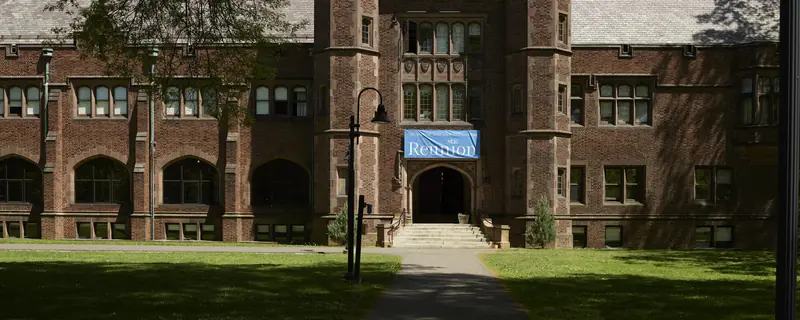
  2. 2View of Mary E. Woodley Hall, the home of the school's alumnae association, at Mount Holyoke College, by Carol M. Highsmith, 2019, from the Library of Congress - master-pnp-highsm-57700-57728aMount Holyoke CollegeComputer Science · South Hadley · 9 mi · $120,021 annual earnings 4 years after graduation, a median across 21 graduatesadmits under 40%$882k

Campus photographs: Worcester Polytechnic Institute by Kenneth C. Zirkel (CC BY-SA 4.0); Mount Holyoke College by Carol M. Highsmith (CC0)

Harder to get into than this college, by the same measure
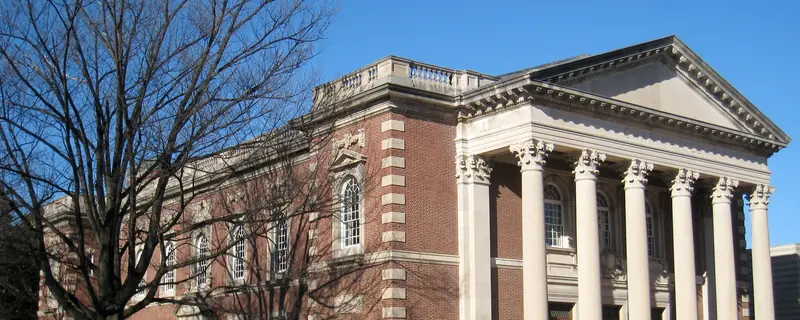
  1. 3Williams College - Chapin HallWilliams CollegeComputer Science · Williamstown · 41 mi · $209,574 annual earnings 4 years after graduation, a median across 35 graduatesadmits 8%$2.29M
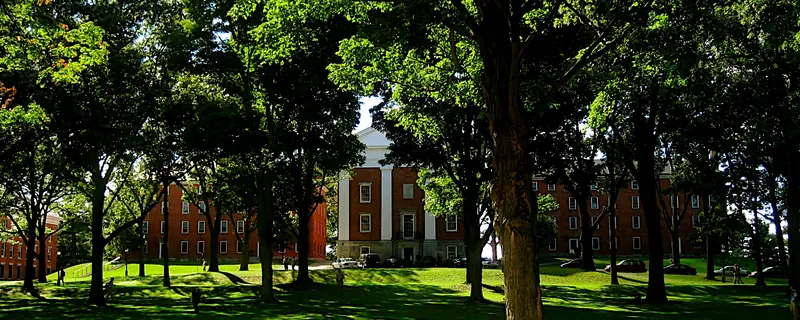
  2. 4Amherst College Main QuadAmherst CollegeComputer Science · Amherst · 1 mi · $142,680 annual earnings 4 years after graduation, a median across 20 graduatesadmits 9%$1.34M
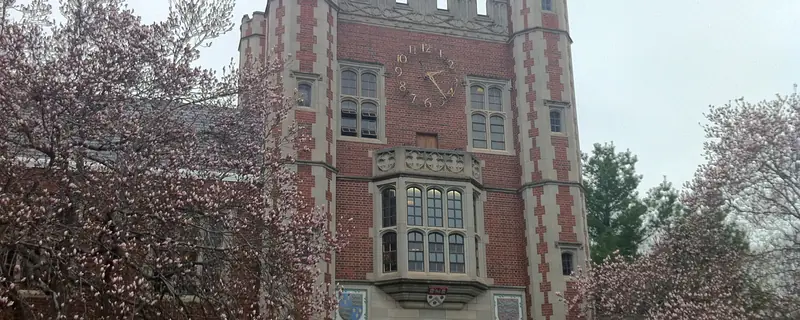
  3. 5Trinity College Clock TowerTrinity CollegeEconomics · Hartford · 45 mi · $122,068 annual earnings 4 years after graduation, a median across 56 graduatesadmits 29%$891k
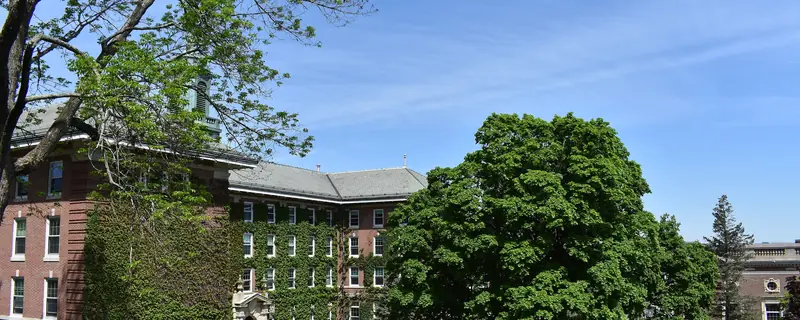
  4. 6Alumni Courtyard DSC 1261College of the Holy CrossEconomics · Worcester · 38 mi · $118,131 annual earnings 4 years after graduation, a median across 126 graduatesadmits 18%$885k

Campus photographs: Williams College by Daderot (Public domain); Amherst College by David Emmerman (CC BY 3.0); Trinity College by Amherst2005 (CC BY-SA 3.0); College of the Holy Cross by GuardianH (CC BY-SA 4.0)

The same programs elsewhere

Holding the subject fixed and changing the college, for this college’s three strongest programs. The list above compares whole colleges at their best; this one answers the narrower question a student who already knows their subject is actually asking.

Computer Science64 colleges pay more
  1. 1Williams College - Chapin HallWilliams CollegeWilliamstown · 41 mi · $209,574 annual earnings 4 years after graduation, a median across 35 graduatesadmits under 40%$2.29M
  2. 2Amherst College Main QuadAmherst CollegeAmherst · 1 mi · $142,680 annual earnings 4 years after graduation, a median across 20 graduatesadmits under 40%$1.34M
  3. 3Boynton Hall, Worcester Polytechnic InstituteWorcester Polytechnic InstituteWorcester · 38 mi · $134,208 annual earnings 4 years after graduation, a median across 166 graduates$1.04M

Campus photographs: Williams College by Daderot (Public domain); Amherst College by David Emmerman (CC BY 3.0); Worcester Polytechnic Institute by Kenneth C. Zirkel (CC BY-SA 4.0)
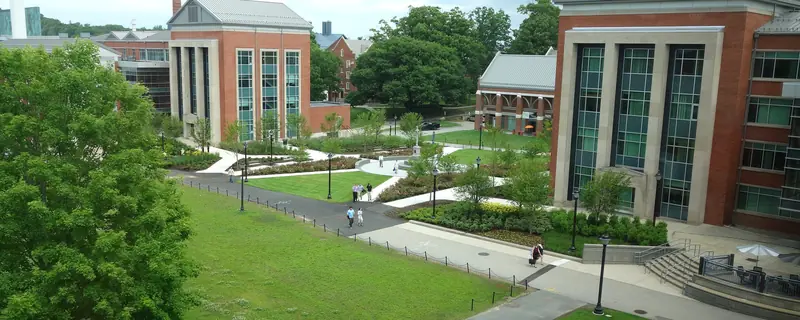
Computer Engineering48 colleges pay more
  1. 1Campus view - University of Connecticut - DSC09948University of ConnecticutStorrs · 42 mi · $115,117 annual earnings 4 years after graduation, a median across 132 graduates5 campuses$745k

Campus photograph: University of Connecticut by Daderot (CC0)

Electrical Electronics and Communications Engineering63 colleges pay more
  1. 1Boynton Hall, Worcester Polytechnic InstituteWorcester Polytechnic InstituteWorcester · 38 mi · $109,386 annual earnings 4 years after graduation, a median across 98 graduates$708k

Campus photograph: Worcester Polytechnic Institute by Kenneth C. Zirkel (CC BY-SA 4.0)

What this college is like

Measured from federal filings, not from a survey. Each figure is compared against four-year colleges, because medians differ too much between sectors for a national comparison to describe anything but the sector.

Teaching
Students per instructor?
17:1
▼more students per instructor than 76% of four-year colleges
Staying and finishing
Come back after year one?
92%
▲higher than 91% of four-year colleges
Finish their credential?
75.6%
▲higher than 94% of four-year colleges
Cost and aid
Yearly cost, family under $30,000?
$6,061
▲cheaper than 91% of four-year colleges
Get a grant from the college?
80%
▼a lower share than 60% of four-year colleges
Receive a Pell Grant?
18%
a lower share than 90% of four-year colleges
The campus
Undergraduates?
25,290
larger than 96% of four-year colleges
Beds per 100 undergraduates?
57
about typical for four-year colleges
Study fully online?
3.9%
about typical for four-year colleges
Graduate students, share of enrollment?
16.5%
about typical for four-year colleges
Play a varsity sport?
2.7%
fewer than 91% of four-year colleges
Who else is there
Mix of student backgrounds?
64 of 100
more varied than 59% of four-year colleges
Choice of subject
Broad subject areas awarded?
28
▲more than 98% of four-year colleges
Also on record
Women and men
52% / 48%
reported, not ranked
Setting
City
reported, not ranked
On-campus housing
Yes
residential
Athletic division
NCAA Division I-FBS
reported, not ranked

Compare every college in this metro

What students are saying

Students and recent alumni of University of Massachusetts-Amherst, in their own words, on Reddit. Every quotation links to the thread it came from.

What came up most

several threads · August to October 2026
PositiveAcademic programs, majors, and the quality of instruction were discussed mostly positively.
The professors are truly amazing and top notch.
r/umass
MixedMaking friends and finding a social community was a recurring concern, with discussion mixed between loneliness and encouragement to join activities.
I have just arrived on campus for a week due to various problems and perfectly missed all the orientations and gatherings. I am wondering how to get to know more people after the semester begins.
r/umass
NeutralHousing and move-in logistics were commonly discussed as practical student concerns rather than as clearly positive or negative experiences.
I originally selected August 31 at 5 PM as my move-in time, but my flight arrives at Boston Logan Airport at around 8 PM on August 31, so I obviously won’t be able to make that time.
r/umass
MixedCampus appearance and campus activity were discussed with a mostly positive but qualified view.
It’s beautiful despite some of the older concrete buildings and campus is active.
r/umass

What students criticized

several threads · November to October 2026
NegativeAn electrical-engineering junior criticized limited academic support and difficult-to-access professors in ECE.
In ECE you usually just have TA and instructor office hours. Some profs will create review sessions before exams but it is pretty rare. Also, some of the professors can be difficult by creating convoluted assignments and not making themselves available.
r/umass
NegativeAn ECE student described the electrical-engineering curriculum as mediocre, with too little elective variety and schedule flexibility.
ECE major. CE is ok, but our EE program is really mediocre. We lack schedule flexibility and variety for higher-level electives.
r/umass
NegativeA recent CNS graduate criticized a perceived lack of academic rigor and limited Honors College offerings.
My experience at UMass was one lacking in academic rigor. I thought the honor college would provide the opportunity to get a more rigorous education at the price of in-state tuition, but the course offerings had few sections, were often limited to mainly first-year courses, and were mainly in larger departments.
r/umass
NegativeStudents complained that Eduroam Wi-Fi was unreliable across residence, dining, and other common campus spaces.
Since the start of the semester, eduroam has had issue after issue for me. It doesn't work in any dining hall, no matter where I sit. It barely works in my room.
r/umass
NegativeA student commenter said campus Wi-Fi coverage was inconsistent enough that finding a usable signal required sitting in a specific dining-hall area.
But the fact we need to find a special place to catch signal is kinda messed up. The wifi coverage is abrupt and sucks ass
r/umass

Compare University of Massachusetts-Amherst with another college · up to four side by side, on return and on what each place is like.

11,340Average annual costAfter grants · In-state · Family income $48k–$75k
83%Finish within six years
25,290Undergraduates
60%Applicants admitted

Where students come from

  • Massachusettsin state69%
  • New York6%
  • Connecticut3%
  • New Jersey3%
  • Outside the US8%

Share of the 5,388 students who entered as first-year undergraduates in 2024. The states shown are the three largest outside Massachusetts, so these do not add to 100%.

At a glance
SettingCity
Undergraduates?25,290
Graduate students4,990
Accepts60%
U.S. News national?#59
Admitted students who enroll?18%
WebsiteVisit umass.edu
AdmissionsAY2024
Applicants50,261
Admitted30,020
Enrolled5,388
SAT middle 50%?1310-1500
ACT middle 50%30-33
Test scores?considered but not required
CostAY2022
Published price, out of state?$39,293
Published price, in state?$17,357
Room and board$14,869
Full year’s cost after grants, by income, in state
Under $30k$6,061
$30k-$48k$7,647
$48k-$75k$11,340
$75k-$110k$17,540
Over $110k$24,211

These are in-state figures. A public college charges more to students from other states, and no out-of-state net price is published, so if you would not be a resident here, read the published prices above for the size of the difference.

Aid · AY2023
Average grant?$10,208 to 80%
Pell students?18%
Federal loan debt · October 2026
Students who borrow?46%
Owed at graduation?$21,500
Monthly, over 10 years?$244/mo
Owed if they leave early?$18,250
Outcomes2018 cohort
Graduate in 4 years76%
Graduate in 6 years83%
Return after year 1?92%
Students per faculty17:1
Most-awarded programs, bachelor'sAY2025
Psychology General528 degrees
Computer Science463 degrees
Finance and Financial Management Services383 degrees
Business Administration Management and Operations361 degrees
Biology General336 degrees
AthleticsAY2024
DivisionNCAA Division I-FBS
Athletes611
Share of undergraduates?3%
Athletic aid$13,585,599
StudentsAY2024
Women / men52% / 48%
White57%
Asian14%
Hispanic9%
International8%
Black5%
Two or more5%

Notes and sources

Total gain after 20 years is what a graduate is ahead at that point: what the degree pays above a high-school graduate in the same state, less four years of net price and the wages given up while studying, weighted by the share of students who finish. At this college that share is 83%, and it is the same for every program on this page because the federal data reports completion for the institution rather than for individual programs. Four-year and open-admission colleges are ranked separately and never pooled.

Annual earnings 4 years after graduation is the median earnings of that program’s graduates at that point, for students who received federal aid, and is published by program. There is no program-level cost anywhere in the federal data, so net price is the college’s figure applied to each program alike. That is sound for ordering programs against one another and should not be read as a precise figure for any one of them.

Cost on this page is always net price, never the published sticker price. Net price is the college’s full cost of attendance for a year, meaning tuition, required fees, books and supplies, and housing and food, with grant and scholarship aid from federal, state and institutional sources subtracted. Loans are not subtracted, because a loan is not a discount. It is an average for first-time full-time undergraduates receiving federal aid, reported by the college in the income bands shown, so it describes a typical family in that band rather than any particular one. A student living at home, paying out-of-state rates or holding an outside scholarship will not see this figure.

Federal loan debt comes from the College Scorecard and is a median among students who borrowed, not an average across everyone. A college where few students take loans can show a high figure and a small bill for most families, so the share who borrow is printed above it and neither should be read without the other. It counts federal student loans only: private loans and Parent PLUS borrowing are not in it and are not published anywhere comparable, which makes this a floor on what a family owes rather than a total. The figure for students who leave without finishing is the same loans without the degree they were taken for. Default rates are deliberately absent: federal repayment was suspended, so the published three-year rate is zero at almost every college in the country and says nothing about any of them.

Most-awarded programs are degrees conferred in AY2025, first majors only, so a double major counts once. Where two programs are within a few degrees of each other the order between them is not meaningful.

Quotations from students were found by a language model searching Reddit, and selected from threads discussing this college in the window shown beside them. Reddit only, so this is not a survey and not a representative sample: who posts and how much varies enormously by the size and type of a college, and for that reason nothing there is scored, totalled or compared between colleges. Post dates are the model’s own reckoning rather than a retrieved field, so treat them as inside the window and not as exact. Each quotation links to its thread.

What this college is like compares each measure against four-year colleges, because medians differ too much between sectors for a national comparison to describe anything but the sector. A position of “higher than 90%” means the college matches or beats nine in ten of them on that measure, which is why the measured figure is printed beside it. Six of those measures have a better end and carry a mark; the rest are positions with no better end and carry none. There is no overall score, because combining them would need weights and the weights would be our opinion rather than a measurement.

Sources. IPEDS, the Department of Education’s annual survey, except where stated. Each block in the column beside shows its own year, because the underlying files are released on different schedules and a single date across all of them would be false. Published tuition is a sticker price and is never used as a cost; net price is. Test scores are the middle 50% of enrolled students who submitted a score, not of admitted applicants, which is why they differ from the figures other guides print. Where a US News rank is shown it is the current edition, published as a fact about the college rather than an endorsement of the ranking.

The photograph at the top of this page was taken by a member of the public and published under a license that permits reuse with credit. It is not supplied by the college, is not endorsed by it, and shows one building on one day rather than the campus as a whole. We do not generate campus images or buy stock photographs of real places, because a picture of a campus that is not that campus is a lie about somewhere real. Full credit: “UMass Amherst campus aerial view.jpg”, Quintin Soloviev, via Wikimedia Commons. CC BY 4.0. Source: https://commons.wikimedia.org/wiki/File:UMass_Amherst_campus_aerial_view.jpg. License/status: https://creativecommons.org/licenses/by/4.0/.

Full methodology