College Sonar
Compare collegesHow it worksFor colleges

Loading

Explore

Look up a collegeDegrees near youCompare collegesTop degrees by stateWhat colleges are like

Understand

How it worksHow badges are awarded

About

For collegesContact us

College Sonar by Optivara © 2026

University of Minnesota-Twin Cities

Minneapolis, MN

Best return on a degreeBroad-access colleges near Minneapolis-St. Paul-Bloomington, MN-WI · family income $48k–$75k · 2027Top 15% for both finishing and returnBroad-access colleges enrolling the fewest low-income students · family income $48k–$75k · 2027Lowest cost for a low-income familyBroad-access colleges near Minneapolis-St. Paul-Bloomington, MN-WI · family income under $30k · 2027Most students return after year oneBroad-access colleges near Minneapolis-St. Paul-Bloomington, MN-WI · 2027
Photo: Ben Franske · CC BY-SA 4.0

Broad access · 78 of 92 programs pay back

35,142 undergraduates, 17 students for every faculty member · Division I-FBS athletics

What this college is like

Best Financial Gain

Estimated over 20 years

$884k

Computer Engineering

Worst Financial Gain

Estimated over 20 years

-$104k

Fishing and Fisheries Sciences and Management

Customize by family incomeUnder $30k$30k to $48k$48k to $75k$75k to $110kOver $110k
Program20 yr Financial Gain
  1. 1Computer Engineering$119,781 annual earnings 4 years after graduation, a median across 67 graduates2 campuses$884k
  2. 2Computer Science$111,661 annual earnings 4 years after graduation, a median across 333 graduates2 campuses$781k
  3. 3International Business$108,566 annual earnings 4 years after graduation, a median across 35 graduates2 campuses$742k
  4. 4Computer Systems Analysis$104,839 annual earnings 4 years after graduation, a median across 114 graduates2 campuses$694k
  5. 5Veterinary Biomedical and Clinical Sciences$103,666 annual earnings 4 years after graduation, a median across 18 graduates2 campuses$679k
  6. 6Computer Systems Networking and Telecommunications$100,554 annual earnings 4 years after graduation, a median across 52 graduates2 campuses$640k
  7. 7Finance and Financial Management Services$98,279 annual earnings 4 years after graduation, a median across 281 graduates2 campuses$611k
  8. 8Biomedical/Medical Engineering$97,611 annual earnings 4 years after graduation, a median across 51 graduates2 campuses$603k
  9. 9Electrical Electronics and Communications Engineering$97,575 annual earnings 4 years after graduation, a median across 93 graduates2 campuses$602k
  10. 10Accounting and Related Services$96,109 annual earnings 4 years after graduation, a median across 134 graduates2 campuses$584k
View all 92 programs →
  1. 11Chemical Engineering$92,946 annual earnings 4 years after graduation, a median across 75 graduates2 campuses$543k
  2. 12Aerospace Aeronautical and Astronautical/Space Engineering$92,422 annual earnings 4 years after graduation, a median across 85 graduates2 campuses$537k
  3. 13Industrial Engineering$92,241 annual earnings 4 years after graduation, a median across 60 graduates2 campuses$534k
  4. 14Construction Management$91,947 annual earnings 4 years after graduation, a median across 56 graduates2 campuses$531k
  5. 15Business Administration Management and Operations$90,284 annual earnings 4 years after graduation, a median across 102 graduates2 campuses$510k
  6. 16Mechanical Engineering$90,061 annual earnings 4 years after graduation, a median across 193 graduates2 campuses$507k
  7. 17Marketing$86,246 annual earnings 4 years after graduation, a median across 224 graduates2 campuses$458k
  8. 18Engineering General$86,148 annual earnings 4 years after graduation, a median across 112 graduates2 campuses$457k
  9. 19Clinical/Medical Laboratory Science/Research and Allied Professions$84,678 annual earnings 4 years after graduation, a median across 50 graduates2 campuses$438k
  10. 20Business/Commerce General$84,516 annual earnings 4 years after graduation, a median across 21 graduates2 campuses$436k
  11. 21Materials Engineering$83,945 annual earnings 4 years after graduation, a median across 41 graduates2 campuses$429k
  12. 22Registered Nursing Nursing Administration Nursing Research and Clinical Nursing$82,960 annual earnings 4 years after graduation, a median across 150 graduates2 campuses$417k
  13. 23Agricultural Engineering$82,946 annual earnings 4 years after graduation, a median across 39 graduates2 campuses$417k
  14. 24Economics$82,488 annual earnings 4 years after graduation, a median across 274 graduates2 campuses$411k
  15. 25Civil Engineering$82,281 annual earnings 4 years after graduation, a median across 65 graduates2 campuses$408k
  16. 26Mathematics$81,864 annual earnings 4 years after graduation, a median across 133 graduates2 campuses$403k
  17. 27Statistics$80,993 annual earnings 4 years after graduation, a median across 56 graduates2 campuses$392k
  18. 28Physics$80,025 annual earnings 4 years after graduation, a median across 36 graduates2 campuses$379k
  19. 29Funeral Service and Mortuary Science$77,420 annual earnings 4 years after graduation, a median across 49 graduates2 campuses$346k
  20. 30Dental Support Services and Allied Professions$76,078 annual earnings 4 years after graduation, a median across 39 graduates2 campuses$329k
  21. 31Communication Journalism and Related Programs Other$74,597 annual earnings 4 years after graduation, a median across 41 graduates2 campuses$311k
  22. 32Human Resources Management and Services$74,358 annual earnings 4 years after graduation, a median across 122 graduates2 campuses$308k
  23. 33Environmental/Environmental Health Engineering$74,252 annual earnings 4 years after graduation, a median across 22 graduates2 campuses$306k
  24. 34Health Services/Allied Health/Health Sciences General$74,079 annual earnings 4 years after graduation, a median across 92 graduates2 campuses$304k
  25. 35Health and Medical Administrative Services$72,862 annual earnings 4 years after graduation, a median across 79 graduates2 campuses$289k
  26. 36Chemistry$71,620 annual earnings 4 years after graduation, a median across 112 graduates2 campuses$273k
  27. 37Liberal Arts and Sciences General Studies and Humanities$70,788 annual earnings 4 years after graduation, a median across 408 graduates2 campuses$262k
  28. 38Food Science and Technology$70,705 annual earnings 4 years after graduation, a median across 27 graduates2 campuses$261k
  29. 39Agricultural Business and Management$69,498 annual earnings 4 years after graduation, a median across 77 graduates2 campuses$246k
  30. 40General Sales Merchandising and Related Marketing Operations$68,903 annual earnings 4 years after graduation, a median across 142 graduates2 campuses$238k
  31. 41Microbiological Sciences and Immunology$68,398 annual earnings 4 years after graduation, a median across 27 graduates2 campuses$232k
  32. 42Education Other$67,795 annual earnings 4 years after graduation, a median across 285 graduates2 campuses$224k
  33. 43Biochemistry Biophysics and Molecular Biology$67,783 annual earnings 4 years after graduation, a median across 53 graduates2 campuses$224k
  34. 44Journalism$66,799 annual earnings 4 years after graduation, a median across 356 graduates2 campuses$212k
  35. 45Education General$66,093 annual earnings 4 years after graduation, a median across 132 graduates2 campuses$203k
  36. 46Cell/Cellular Biology and Anatomical Sciences$65,497 annual earnings 4 years after graduation, a median across 44 graduates2 campuses$195k
  37. 47Political Science and Government$65,487 annual earnings 4 years after graduation, a median across 245 graduates2 campuses$195k
  38. 48Architecture and Related Services Other$64,652 annual earnings 4 years after graduation, a median across 39 graduates2 campuses$184k
  39. 49Physiology Pathology and Related Sciences$64,629 annual earnings 4 years after graduation, a median across 232 graduates2 campuses$184k
  40. 50Biology General$63,132 annual earnings 4 years after graduation, a median across 301 graduates2 campuses$165k
  41. 51Urban Studies/Affairs$62,807 annual earnings 4 years after graduation, a median across 30 graduates2 campuses$161k
  42. 52Design and Applied Arts$62,414 annual earnings 4 years after graduation, a median across 141 graduates2 campuses$156k
  43. 53Architecture$62,246 annual earnings 4 years after graduation, a median across 108 graduates2 campuses$154k
  44. 54Sports Kinesiology and Physical Education/Fitness$60,931 annual earnings 4 years after graduation, a median across 96 graduates2 campuses$137k
  45. 55Geological and Earth Sciences/Geosciences$60,715 annual earnings 4 years after graduation, a median across 22 graduates2 campuses$134k
  46. 56Rhetoric and Composition/Writing Studies$60,415 annual earnings 4 years after graduation, a median across 244 graduates2 campuses$131k
  47. 57Communication Disorders Sciences and Services$60,312 annual earnings 4 years after graduation, a median across 66 graduates2 campuses$129k
  48. 58Multi/Interdisciplinary Studies Other$60,270 annual earnings 4 years after graduation, a median across 476 graduates2 campuses$129k
  49. 59Apparel and Textiles$59,879 annual earnings 4 years after graduation, a median across 21 graduates2 campuses$124k
  50. 60Neurobiology and Neurosciences$59,568 annual earnings 4 years after graduation, a median across 43 graduates2 campuses$120k
  51. 61Nutrition Sciences$59,054 annual earnings 4 years after graduation, a median across 100 graduates2 campuses$113k
  52. 62Criminology$59,022 annual earnings 4 years after graduation, a median across 150 graduates2 campuses$113k
  53. 63Special Education and Teaching$58,675 annual earnings 4 years after graduation, a median across 23 graduates2 campuses$109k
  54. 64Forestry$58,651 annual earnings 4 years after graduation, a median across 66 graduates2 campuses$108k
  55. 65Psychology General$58,449 annual earnings 4 years after graduation, a median across 445 graduates2 campuses$106k
  56. 66Natural Resources Conservation and Research$56,916 annual earnings 4 years after graduation, a median across 104 graduates2 campuses$86k
  57. 67Sociology$56,690 annual earnings 4 years after graduation, a median across 101 graduates2 campuses$83k
  58. 68International Relations and National Security Studies$56,257 annual earnings 4 years after graduation, a median across 92 graduates2 campuses$78k
  59. 69Teacher Education and Professional Development Specific Subject Areas$54,799 annual earnings 4 years after graduation, a median across 21 graduates2 campuses$59k
  60. 70History$54,659 annual earnings 4 years after graduation, a median across 114 graduates2 campuses$58k
  61. 71Parks Recreation and Leisure Studies$53,854 annual earnings 4 years after graduation, a median across 29 graduates2 campuses$47k
  62. 72Geography and Cartography$53,666 annual earnings 4 years after graduation, a median across 37 graduates2 campuses$45k
  63. 73Teacher Education and Professional Development Specific Levels and Methods$53,276 annual earnings 4 years after graduation, a median across 132 graduates2 campuses$40k
  64. 74Romance Languages Literatures and Linguistics$53,276 annual earnings 4 years after graduation, a median across 66 graduates2 campuses$40k
  65. 75Philosophy$53,189 annual earnings 4 years after graduation, a median across 32 graduates2 campuses$39k
  66. 76Family and Consumer Economics and Related Studies$53,055 annual earnings 4 years after graduation, a median across 106 graduates2 campuses$37k
  67. 77Plant Sciences$52,707 annual earnings 4 years after graduation, a median across 29 graduates2 campuses$33k
  68. 78Animal Sciences$51,271 annual earnings 4 years after graduation, a median across 106 graduates2 campuses$15k
  69. 79Ecology Evolution Systematics and Population Biology$50,106 annual earnings 4 years after graduation, a median across 25 graduates2 campuses-$112
  70. 80Research and Experimental Psychology$50,098 annual earnings 4 years after graduation, a median across 89 graduates2 campuses-$213
  71. 81Ethnic Cultural Minority Gender and Group Studies$49,305 annual earnings 4 years after graduation, a median across 47 graduates2 campuses-$10k
  72. 82Dance$48,069 annual earnings 4 years after graduation, a median across 20 graduates2 campuses-$26k
  73. 83Anthropology$48,010 annual earnings 4 years after graduation, a median across 43 graduates2 campuses-$27k
  74. 84English Language and Literature General$47,873 annual earnings 4 years after graduation, a median across 169 graduates2 campuses-$28k
  75. 85Film/Video and Photographic Arts$47,707 annual earnings 4 years after graduation, a median across 38 graduates2 campuses-$31k
  76. 86Linguistic Comparative and Related Language Studies and Services$46,081 annual earnings 4 years after graduation, a median across 49 graduates2 campuses-$51k
  77. 87Fine and Studio Arts$44,850 annual earnings 4 years after graduation, a median across 96 graduates2 campuses-$67k
  78. 88Drama/Theatre Arts and Stagecraft$43,055 annual earnings 4 years after graduation, a median across 58 graduates2 campuses-$90k
  79. 89Germanic Languages Literatures and Linguistics$42,989 annual earnings 4 years after graduation, a median across 18 graduates2 campuses-$90k
  80. 90East Asian Languages Literatures and Linguistics$42,569 annual earnings 4 years after graduation, a median across 45 graduates2 campuses-$96k
  81. 91Music$42,232 annual earnings 4 years after graduation, a median across 19 graduates2 campuses-$100k
  82. 92Fishing and Fisheries Sciences and Management$41,934 annual earnings 4 years after graduation, a median across 56 graduates2 campuses-$104k

This college's programs pay very differently from one another, so any single figure for the college as a whole would hide more than it shows.

Other colleges to consider

Every college here returns more than this one’s best program, within 250 miles. Only one college within 50 miles returns more, so the search was widened to 250 miles rather than showing you almost nothing.

Some of these admit a different share of applicants, marked on each row. A more selective college is a different application, not a free upgrade, and part of why its graduates earn more is who it admitted in the first place.
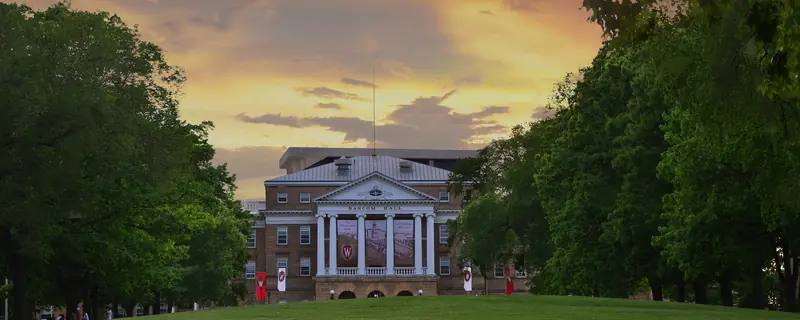
  1. 1Bascom Hall, Madison, Wisconsin 05-19-2012 365University of Wisconsin-MadisonReal Estate · Madison · 231 mi · $120,483 annual earnings 4 years after graduation, a median across 83 graduatesadmits 40-70%$958k
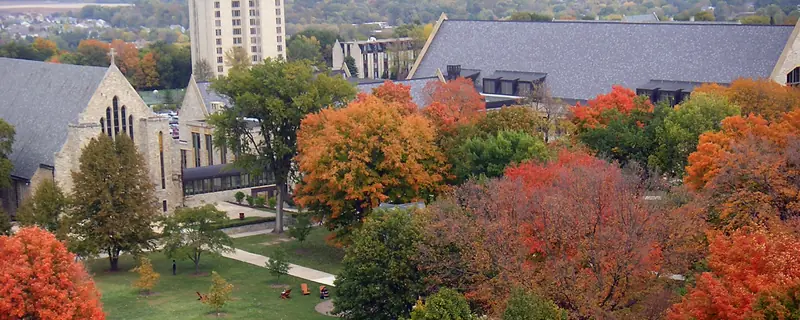
  2. 2StOlaf College CampusSt Olaf CollegeComputer Science · Northfield · 35 mi · $122,912 annual earnings 4 years after graduation, a median across 23 graduatesadmits 40-70%$924k
Campus photographs: University of Wisconsin-Madison by Richard Hurd / RAHurd (CC BY-SA 3.0); St Olaf College by Daniel Edwins a.k.a. Webmoof of English Wikipedia (CC BY-SA 2.5)

The same programs elsewhere

Holding the subject fixed and changing the college, for this college’s three strongest programs. The list above compares whole colleges at their best; this one answers the narrower question a student who already knows their subject is actually asking.

Computer Engineering33 colleges pay more
  1. 1Bascom Hall, Madison, Wisconsin 05-19-2012 365University of Wisconsin-MadisonMadison · 231 mi · $120,068 annual earnings 4 years after graduation, a median across 58 graduatesadmits 40-70%$952k

Campus photograph: University of Wisconsin-Madison by Richard Hurd / RAHurd (CC BY-SA 3.0)

Computer Science76 colleges pay more
  1. 1StOlaf College CampusSt Olaf CollegeNorthfield · 35 mi · $122,912 annual earnings 4 years after graduation, a median across 23 graduatesadmits 40-70%$924k
  2. 2Grinnell College MacEachron FieldGrinnell CollegeGrinnell · 224 mi · $109,892 annual earnings 4 years after graduation, a median across 36 graduatesadmits under 40%$791k

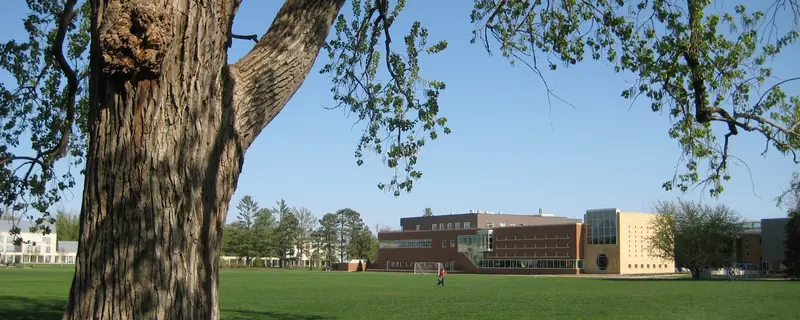
Campus photographs: St Olaf College by Daniel Edwins a.k.a. Webmoof of English Wikipedia (CC BY-SA 2.5); Grinnell College by Aureliusxv (CC BY-SA 3.0)

International Business4 colleges pay more
  1. 1Bascom Hall, Madison, Wisconsin 05-19-2012 365University of Wisconsin-MadisonMadison · 231 mi · $106,783 annual earnings 4 years after graduation, a median across 27 graduatesadmits 40-70%$775k

Campus photograph: University of Wisconsin-Madison by Richard Hurd / RAHurd (CC BY-SA 3.0)

Read these with care. The federal earnings data for this college is reported under an identifier shared by 2 campuses, so each figure describes those campuses together rather than this one alone.

What this college is like

Measured from federal filings, not from a survey. Each figure is compared against four-year colleges, because medians differ too much between sectors for a national comparison to describe anything but the sector.

Teaching
Students per instructor?
17:1
▼more students per instructor than 76% of four-year colleges
Staying and finishing
Come back after year one?
91%
▲higher than 89% of four-year colleges
Finish their credential?
74.1%
▲higher than 92% of four-year colleges
Cost and aid
Yearly cost, family under $30,000?
$6,720
▲cheaper than 89% of four-year colleges
Get a grant from the college?
63%
▼a lower share than 75% of four-year colleges
Receive a Pell Grant?
24%
a lower share than 80% of four-year colleges
The campus
Undergraduates?
35,142
larger than 98% of four-year colleges
Beds per 100 undergraduates?
22
fewer than 90% of four-year colleges
Study fully online?
2%
fewer than 64% of four-year colleges
Graduate students, share of enrollment?
18.6%
more than 61% of four-year colleges
Play a varsity sport?
2%
fewer than 95% of four-year colleges
Who else is there
Mix of student backgrounds?
65 of 100
more varied than 62% of four-year colleges
Choice of subject
Broad subject areas awarded?
29
▲more than 99% of four-year colleges
Also on record
Women and men
55% / 45%
reported, not ranked
Setting
City
reported, not ranked
On-campus housing
Yes
residential
Athletic division
NCAA Division I-FBS
reported, not ranked

Compare every college in this metro

What students are saying

Students and recent alumni of University of Minnesota-Twin Cities, in their own words, on Reddit. Every quotation links to the thread it came from.

What came up most

several threads · August to October 2026
NegativeTuition, dorm-and-meal-plan costs, and borrowing to afford attendance were discussed mostly negatively.
Dorming at the U also requires me to have a meal plan which is crazy expensive. Just the dorm and meal plan costs 15k for both semesters which is absolutely insane.
r/uofmn
PositiveCourse planning, especially getting into full classes and finding enjoyable electives, was discussed mostly positively and helpfully.
the time most people drop a course is going to be the first week.
r/uofmn

What students criticized

several threads · November to October 2026
NegativeStudents complained that CLA advising was difficult to access and that course and office-hour scheduling obstructed timely graduation.
I’m genuinely so freaking sick of all these advising departments literally gatekeeping appointments.
r/uofmn
NegativeA student criticized the lack of financial aid relative to the cost of attending as an in-state student.
My family doesn't make enough to actually afford this insane cost--why is it so expensive even in state?
r/uofmn
NegativeAn incoming CBS student complained that required dormitory housing and the meal plan were unaffordable.
Dorming at the U also requires me to have a meal plan which is crazy expensive. Just the dorm and meal plan costs 15k for both semesters which is absolutely insane.
r/uofmn
NegativeStudents complained about tuition surcharges and accumulating fees beyond the advertised course cost.
Yeah, they make much of tuition not rising too much (?) but then the fees just keep multiplying.
r/uofmn
NegativeStudents described the Twin Cities campus as socially isolating and ineffective at helping them form lasting friendships despite participation in clubs.
This school feels so indifferent.
r/uofmn
NegativeA recent graduate criticized an art-department and instructor failure that resulted in lost work and an incomplete temporarily becoming an F.
UMN art department threw away 6 large oil paintings without warning while I was dealing with medical issues because my professor forgot to email me about it when I wasn’t in class.
r/uofmn

Changes and news students discussed

several threads · August to October 2026
NegativeDiscussion focused on planned University-wide budget reductions and related tuition increases.
"We expect to reduce the overall University budget by $225 million over two years. This equates to 12-15% of allocated operating revenue."
r/uofmn
NegativePeople discussed a reported $25 million reduction target for the College of Liberal Arts, with concern that it would affect undergraduate class sizes and support.
"When 25 million dollars of cuts hit CLA, that hits all UMN undergraduate students who have to get their Lib Ed core requirements met. It means bigger classes, less classroom support."
r/uofmn
MixedA St. Paul-campus thread discussed Magrath Library being closed during redevelopment that commenters said would add a library, student center, and dorms.
"Magrath is closed right now because the St. Paul campus is getting a new library/student center/dorms, but there is another library on the St. Paul campus in Hodson Hall."
r/uofmn

Compare University of Minnesota-Twin Cities with another college · up to four side by side, on return and on what each place is like.

6,720Average annual costAfter grants · In-state · Family income Under $30k
85%Finish within six years
35,142Undergraduates
80%Applicants admitted

Where students come from

  • Minnesotain state65%
  • Wisconsin14%
  • Illinois3%
  • South Dakota1%
  • Outside the US7%

Share of the 7,405 students who entered as first-year undergraduates in 2024. The states shown are the three largest outside Minnesota, so these do not add to 100%.

At a glance
SettingCity
Undergraduates?35,142
Graduate students8,026
Accepts80%
U.S. News national?#59
Admitted students who enroll?22%
WebsiteVisit twin-cities.umn.edu
AdmissionsAY2024
Applicants41,496
Admitted33,091
Enrolled7,391
SAT middle 50%?1300-1500
ACT middle 50%26-31
Test scores?considered but not required
CostAY2022
Published price, out of state?$36,402
Published price, in state?$16,488
Room and board$13,028
Full year’s cost after grants, by income, in state
Under $30k$6,720
$30k-$48k$8,356
$48k-$75k$11,603
$75k-$110k$18,140
Over $110k$24,979

These are in-state figures. A public college charges more to students from other states, and no out-of-state net price is published, so if you would not be a resident here, read the published prices above for the size of the difference.

Aid · AY2023
Average grant?$7,062 to 63%
Pell students?24%
Federal loan debt · October 2026
Students who borrow?28%
Owed at graduation?$19,350
Monthly, over 10 years?$220/mo
Owed if they leave early?$6,500
Outcomes2018 cohort
Graduate in 4 years74%
Graduate in 6 years85%
Return after year 1?91%
Students per faculty17:1
Most-awarded programs, bachelor'sAY2025
Computer Science617 degrees
Psychology General561 degrees
Finance and Financial Management Services296 degrees
Physiology Pathology and Related Sciences293 degrees
Biology General290 degrees
AthleticsAY2024
DivisionNCAA Division I-FBS
Athletes607
Share of undergraduates?2%
Athletic aid$19,021,913
StudentsAY2024
Women / men55% / 45%
White56%
Asian13%
Black9%
Hispanic7%
Two or more5%
International5%

Notes and sources

Total gain after 20 years is what a graduate is ahead at that point: what the degree pays above a high-school graduate in the same state, less four years of net price and the wages given up while studying, weighted by the share of students who finish. At this college that share is 85%, and it is the same for every program on this page because the federal data reports completion for the institution rather than for individual programs. Four-year and open-admission colleges are ranked separately and never pooled.

Annual earnings 4 years after graduation is the median earnings of that program’s graduates at that point, for students who received federal aid, and is published by program. There is no program-level cost anywhere in the federal data, so net price is the college’s figure applied to each program alike. That is sound for ordering programs against one another and should not be read as a precise figure for any one of them.

Cost on this page is always net price, never the published sticker price. Net price is the college’s full cost of attendance for a year, meaning tuition, required fees, books and supplies, and housing and food, with grant and scholarship aid from federal, state and institutional sources subtracted. Loans are not subtracted, because a loan is not a discount. It is an average for first-time full-time undergraduates receiving federal aid, reported by the college in the income bands shown, so it describes a typical family in that band rather than any particular one. A student living at home, paying out-of-state rates or holding an outside scholarship will not see this figure.

Federal loan debt comes from the College Scorecard and is a median among students who borrowed, not an average across everyone. A college where few students take loans can show a high figure and a small bill for most families, so the share who borrow is printed above it and neither should be read without the other. It counts federal student loans only: private loans and Parent PLUS borrowing are not in it and are not published anywhere comparable, which makes this a floor on what a family owes rather than a total. The figure for students who leave without finishing is the same loans without the degree they were taken for. Default rates are deliberately absent: federal repayment was suspended, so the published three-year rate is zero at almost every college in the country and says nothing about any of them.

Most-awarded programs are degrees conferred in AY2025, first majors only, so a double major counts once. Where two programs are within a few degrees of each other the order between them is not meaningful.

Quotations from students were found by a language model searching Reddit, and selected from threads discussing this college in the window shown beside them. Reddit only, so this is not a survey and not a representative sample: who posts and how much varies enormously by the size and type of a college, and for that reason nothing there is scored, totalled or compared between colleges. Post dates are the model’s own reckoning rather than a retrieved field, so treat them as inside the window and not as exact. Each quotation links to its thread.

What this college is like compares each measure against four-year colleges, because medians differ too much between sectors for a national comparison to describe anything but the sector. A position of “higher than 90%” means the college matches or beats nine in ten of them on that measure, which is why the measured figure is printed beside it. Six of those measures have a better end and carry a mark; the rest are positions with no better end and carry none. There is no overall score, because combining them would need weights and the weights would be our opinion rather than a measurement.

Sources. IPEDS, the Department of Education’s annual survey, except where stated. Each block in the column beside shows its own year, because the underlying files are released on different schedules and a single date across all of them would be false. Published tuition is a sticker price and is never used as a cost; net price is. Test scores are the middle 50% of enrolled students who submitted a score, not of admitted applicants, which is why they differ from the figures other guides print. Where a US News rank is shown it is the current edition, published as a fact about the college rather than an endorsement of the ranking.

The photograph at the top of this page was taken by a member of the public and published under a license that permits reuse with credit. It is not supplied by the college, is not endorsed by it, and shows one building on one day rather than the campus as a whole. We do not generate campus images or buy stock photographs of real places, because a picture of a campus that is not that campus is a lie about somewhere real. Full credit: “UMN-NorthrupMall.jpg”, Ben Franske, via Wikimedia Commons. CC BY-SA 4.0. Source: https://commons.wikimedia.org/wiki/File:UMN-NorthrupMall.jpg. License/status: https://creativecommons.org/licenses/by-sa/4.0/.

Full methodology