College Sonar
Compare collegesHow it worksFor colleges

Loading

Explore

Look up a collegeDegrees near youCompare collegesTop degrees by stateWhat colleges are like

Understand

How it worksHow badges are awarded

About

For collegesContact us

College Sonar by Optivara © 2026

New York University

New York, NY

Photo: Jonathan71 · CC BY-SA 2.5

Selective · 39 of 45 programs pay back

32,187 undergraduates, 8 students for every faculty member · Division III without football athletics · Graduate students are 39% of total enrollment

What this college is like

Best Financial Gain

Estimated over 20 years

$1.35M

Management Sciences and Quantitative Methods

Worst Financial Gain

Estimated over 20 years

-$214k

Dance

Customize by family incomeUnder $30k$30k to $48k$48k to $75k$75k to $110kOver $110k
Program20 yr Financial Gain
  1. 1Management Sciences and Quantitative Methods$158,559 annual earnings 4 years after graduation, a median across 98 graduates$1.35M
  2. 2Computer and Information Sciences General$142,495 annual earnings 4 years after graduation, a median across 376 graduates$1.14M
  3. 3Business/Commerce General$137,804 annual earnings 4 years after graduation, a median across 285 graduates$1.08M
  4. 4Real Estate$130,716 annual earnings 4 years after graduation, a median across 23 graduates$987k
  5. 5Mathematics and Statistics Other$129,073 annual earnings 4 years after graduation, a median across 24 graduates$965k
  6. 6Computer Engineering$127,201 annual earnings 4 years after graduation, a median across 45 graduates$941k
  7. 7Registered Nursing Nursing Administration Nursing Research and Clinical Nursing$118,433 annual earnings 4 years after graduation, a median across 514 graduates$827k
  8. 8Economics$116,510 annual earnings 4 years after graduation, a median across 225 graduates$802k
  9. 9Engineering-Related Fields$114,572 annual earnings 4 years after graduation, a median across 23 graduates$777k
  10. 10Electrical Electronics and Communications Engineering$107,348 annual earnings 4 years after graduation, a median across 52 graduates$682k
View all 45 programs →
  1. 11Civil Engineering$94,867 annual earnings 4 years after graduation, a median across 40 graduates$520k
  2. 12Dental Support Services and Allied Professions$82,978 annual earnings 4 years after graduation, a median across 78 graduates$496k
  3. 13Social Sciences General$91,917 annual earnings 4 years after graduation, a median across 71 graduates$481k
  4. 14Mathematics$91,832 annual earnings 4 years after graduation, a median across 23 graduates$480k
  5. 15Mechanical Engineering$91,821 annual earnings 4 years after graduation, a median across 81 graduates$480k
  6. 16Chemical Engineering$89,744 annual earnings 4 years after graduation, a median across 60 graduates$453k
  7. 17Business Management Marketing and Related Support Services Other$87,656 annual earnings 4 years after graduation, a median across 81 graduates$426k
  8. 18Chemistry$86,197 annual earnings 4 years after graduation, a median across 18 graduates$407k
  9. 19Hospitality Administration/Management$84,375 annual earnings 4 years after graduation, a median across 35 graduates$383k
  10. 20Urban Studies/Affairs$81,123 annual earnings 4 years after graduation, a median across 20 graduates$341k
  11. 21Political Science and Government$80,957 annual earnings 4 years after graduation, a median across 126 graduates$339k
  12. 22Sociology$77,650 annual earnings 4 years after graduation, a median across 24 graduates$295k
  13. 23Radio Television and Digital Communication$77,109 annual earnings 4 years after graduation, a median across 235 graduates$288k
  14. 24Communication Disorders Sciences and Services$75,970 annual earnings 4 years after graduation, a median across 21 graduates$274k
  15. 25Social Sciences Other$74,983 annual earnings 4 years after graduation, a median across 54 graduates$261k
  16. 26History$74,545 annual earnings 4 years after graduation, a median across 41 graduates$255k
  17. 27Public Health$70,840 annual earnings 4 years after graduation, a median across 45 graduates$207k
  18. 28Nutrition Sciences$70,508 annual earnings 4 years after graduation, a median across 25 graduates$202k
  19. 29Physics$69,334 annual earnings 4 years after graduation, a median across 43 graduates$187k
  20. 30Biochemistry Biophysics and Molecular Biology$68,690 annual earnings 4 years after graduation, a median across 32 graduates$179k
  21. 31Liberal Arts and Sciences General Studies and Humanities$66,502 annual earnings 4 years after graduation, a median across 375 graduates$150k
  22. 32English Language and Literature General$66,306 annual earnings 4 years after graduation, a median across 78 graduates$148k
  23. 33Ecology Evolution Systematics and Population Biology$65,406 annual earnings 4 years after graduation, a median across 19 graduates$136k
  24. 34Teacher Education and Professional Development Specific Levels and Methods$64,640 annual earnings 4 years after graduation, a median across 34 graduates$126k
  25. 35Research and Experimental Psychology$63,315 annual earnings 4 years after graduation, a median across 184 graduates$109k
  26. 36Area Studies$62,651 annual earnings 4 years after graduation, a median across 20 graduates$100k
  27. 37Social Work$59,593 annual earnings 4 years after graduation, a median across 23 graduates$60k
  28. 38Film/Video and Photographic Arts$58,720 annual earnings 4 years after graduation, a median across 332 graduates$49k
  29. 39Biology General$58,513 annual earnings 4 years after graduation, a median across 55 graduates$46k
  30. 40Music$52,841 annual earnings 4 years after graduation, a median across 74 graduates-$28k
  31. 41Philosophy$52,633 annual earnings 4 years after graduation, a median across 16 graduates-$30k
  32. 42Fine and Studio Arts$49,478 annual earnings 4 years after graduation, a median across 37 graduates-$72k
  33. 43Visual and Performing Arts Other$45,991 annual earnings 4 years after graduation, a median across 73 graduates-$117k
  34. 44Drama/Theatre Arts and Stagecraft$42,348 annual earnings 4 years after graduation, a median across 390 graduates-$164k
  35. 45Dance$38,571 annual earnings 4 years after graduation, a median across 33 graduates-$214k
Other colleges to consider

Every college here returns more than this one’s best program, within 250 miles. Only 26% of students here come from NY, so the search is wider than the usual 50 miles: for a college people travel to, the colleges down the road are not the real alternatives.
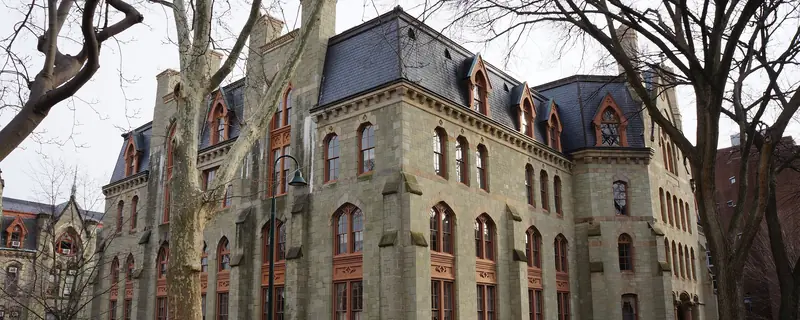
  1. 1College Hall, University of PennsylvaniaUniversity of PennsylvaniaComputer and Information Sciences General · Philadelphia · 83 mi · $241,380 annual earnings 4 years after graduation, a median across 40 graduates$2.81M
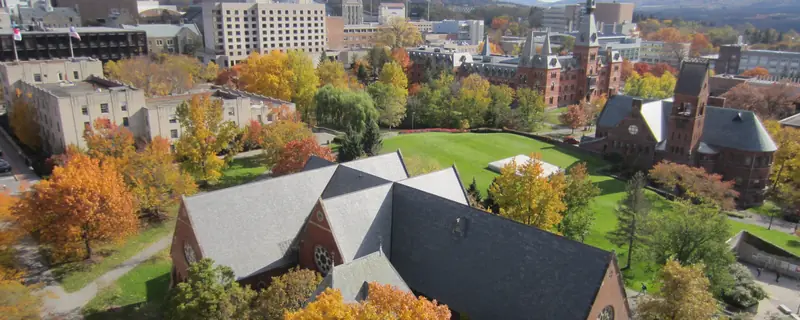
  2. 2Cornell University from McGraw TowerCornell UniversityComputer Science · Ithaca · 175 mi · $223,309 annual earnings 4 years after graduation, a median across 296 graduates2 campuses$2.52M
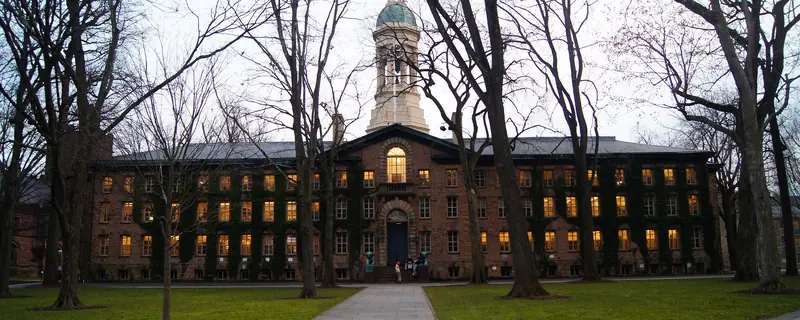
  3. 3Nassau Hall Princeton UniPrinceton UniversityComputer Science · Princeton · 44 mi · $217,973 annual earnings 4 years after graduation, a median across 30 graduates$2.49M
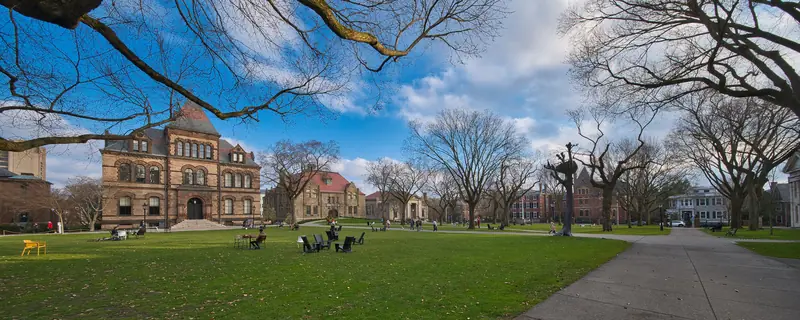
  4. 4Main Green at Brown UniversityBrown UniversityComputer Science · Providence · 155 mi · $214,479 annual earnings 4 years after graduation, a median across 116 graduates$2.38M
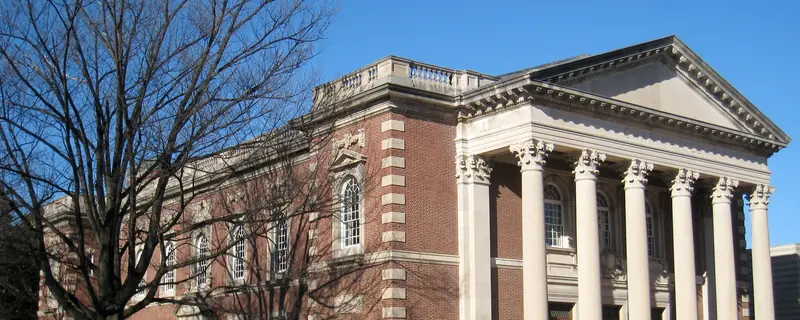
  5. 5Williams College - Chapin HallWilliams CollegeComputer Science · Williamstown · 143 mi · $209,574 annual earnings 4 years after graduation, a median across 35 graduates$2.29M
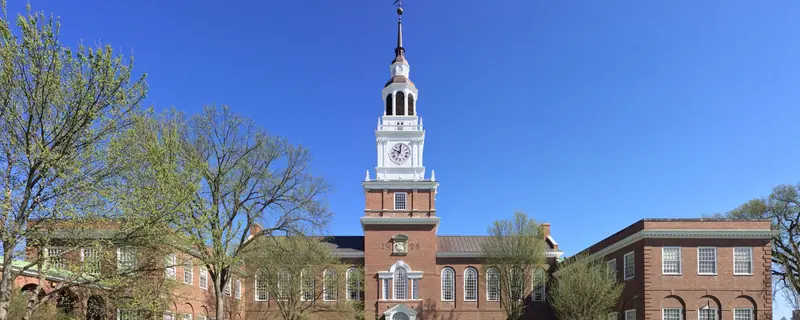
  6. 6Baker-Library-Dartmouth-College-Hanover-New-Hampshire-05-2018aDartmouth CollegeComputer Science · Hanover · 223 mi · $201,702 annual earnings 4 years after graduation, a median across 62 graduates$2.18M

Campus photographs: University of Pennsylvania by Michel Alexandre Salim (CC BY-SA 2.0); Cornell University by Maeshima hiroki (CC BY-SA 3.0); Princeton University by Rohit Hirway (CC BY-SA 3.0); Brown University by Chris Rycroft (CC BY 2.0); Williams College by Daderot (Public domain); Dartmouth College by Gunnar Klack (CC BY-SA 4.0)

The same programs elsewhere

Holding the subject fixed and changing the college, for this college’s three strongest programs. The list above compares whole colleges at their best; this one answers the narrower question a student who already knows their subject is actually asking.

Management Sciences and Quantitative Methods1 college pays more
  1. 1College Hall, University of PennsylvaniaUniversity of PennsylvaniaPhiladelphia · 83 mi · $153,279 annual earnings 4 years after graduation, a median across 25 graduates$1.55M

Campus photograph: University of Pennsylvania by Michel Alexandre Salim (CC BY-SA 2.0)

Computer and Information Sciences General18 colleges pay more
  1. 1College Hall, University of PennsylvaniaUniversity of PennsylvaniaPhiladelphia · 83 mi · $241,380 annual earnings 4 years after graduation, a median across 40 graduates$2.81M
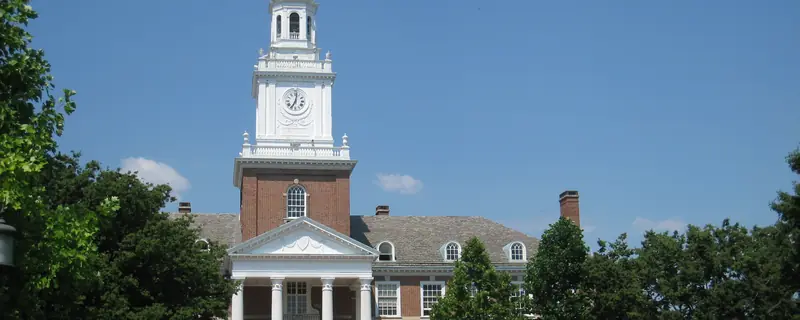
  2. 2Gilman Hall, Johns Hopkins University, Baltimore, MDJohns Hopkins UniversityBaltimore · 169 mi · $196,467 annual earnings 4 years after graduation, a median across 58 graduates$2.10M
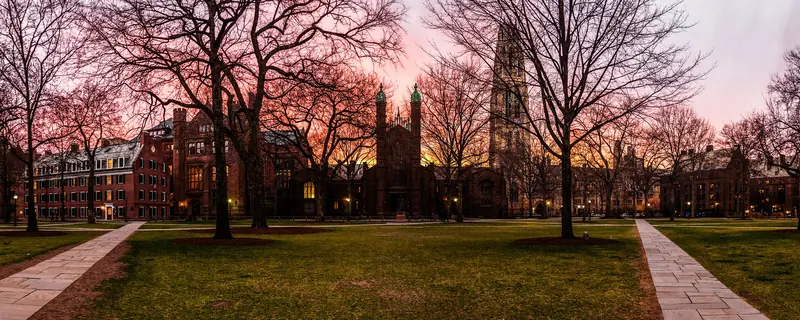
  3. 3Old campusYale UniversityNew Haven · 69 mi · $188,157 annual earnings 4 years after graduation, a median across 31 graduates$2.03M

Campus photographs: University of Pennsylvania by Michel Alexandre Salim (CC BY-SA 2.0); Johns Hopkins University by Daderot (Public domain); Yale University by Namkota (CC BY-SA 4.0)
Business/Commerce General1 college pays more, none of them nearby
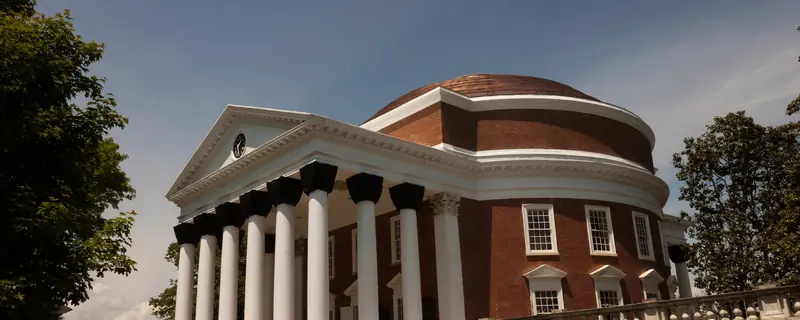
  1. 1Rotunda - University of VirginiaUniversity of Virginia-Main CampusCharlottesville · 304 mi · $142,113 annual earnings 4 years after graduation, a median across 88 graduates$1.31M

Campus photograph: University of Virginia-Main Campus by Robert Emerson (CC BY-SA 3.0)

What this college is like

Measured from federal filings, not from a survey. Each figure is compared against four-year colleges, because medians differ too much between sectors for a national comparison to describe anything but the sector.

Teaching
Students per instructor?
8:1
▲fewer students per instructor than 93% of four-year colleges
Staying and finishing
Come back after year one?
96%
▲higher than 96% of four-year colleges
Finish their credential?
75.6%
▲higher than 93% of four-year colleges
Cost and aid
Yearly cost, family under $30,000?
$23,476
▼more expensive than 88% of four-year colleges
Get a grant from the college?
35%
▼a lower share than 91% of four-year colleges
Receive a Pell Grant?
19%
a lower share than 88% of four-year colleges
The campus
Undergraduates?
32,187
larger than 97% of four-year colleges
Beds per 100 undergraduates?
39
fewer than 70% of four-year colleges
Study fully online?
0.9%
fewer than 70% of four-year colleges
Graduate students, share of enrollment?
39.4%
more than 88% of four-year colleges
Play a varsity sport?
1.8%
fewer than 96% of four-year colleges
Who else is there
Mix of student backgrounds?
81 of 100
more varied than 98% of four-year colleges
Choice of subject
Broad subject areas awarded?
28
▲more than 98% of four-year colleges
Also on record
Women and men
59% / 41%
reported, not ranked
Setting
City
reported, not ranked
On-campus housing
Yes
residential
Athletic division
NCAA Division III without football
reported, not ranked

Compare every college in this metro

What students are saying

Students and recent alumni of New York University, in their own words, on Reddit. Every quotation links to the thread it came from.

What came up most

several threads · August to October 2026
NegativeAffordability, tuition, and gaps in financial aid were a recurring topic, mostly negative.
Unfortunately, NYU doesn’t make it affordable, even if you’re considered low income.
r/nyu
MixedMaking friends and adjusting to NYU’s nontraditional campus social life was commonly discussed, with mixed experiences.
I'm struggling to meet people and make friends because it's not the most social university
r/nyu
MixedWhether to apply early decision or choose NYU was a frequent prospective-student discussion, with mixed sentiment.
NYU is lowkey my dream uni if i even have one, mostly cause of the location, but seeing all the stories and shi seems like people's experience isnt that good
r/nyu

What students said they valued

several threads · November to October 2026
PositiveStudents valued NYU’s city-based experience, especially access to culture, food, and nightlife rather than a conventional campus social scene.
Having access to some of the world’s best cultural activities, food, nightlife, etc was a more fulfilling and enriching experience for me.
r/nyu
PositiveAn alumnus valued the maturity and real-world perspective they felt came from living in New York while attending NYU.
Just the deoth and nuances of living in nyc at that age was priceless. So no regrets.
r/nyu
PositiveA student liked that NYU’s setting made it easier to meet people beyond the university and practice independence.
I like the fact that it’s easier to meet people outside of school since our campus is right in the city.
r/nyu
PositiveA first-year student described the overall college experience positively and appreciated the city environment.
Pretty great actually.
r/nyu
PositiveA Tandon student valued its relaxed, close-knit community.
Very cool community and very laid back group of people, I will miss the Tandon community so, so, much!
r/nyu
PositiveA Tandon graduate student especially valued the diversity of people and life experiences encountered at NYU.
Diversity. People of all backgrounds and insights converge at NYU.
r/nyu
PositiveA current SPS DAUS student valued the program’s affordability, small community, and opportunities associated with NYU.
im on a full ride at daus and love the affordability!! sps community is small but amazing.
r/nyu
PositiveA senior who attended NYU’s Washington, D.C. first-year program valued its small community and organized excursions.
Very small community where everyone knows everyone. They took us on a lot of fun excursions.
r/nyu

What students criticized

several threads · November to October 2026
NegativeA student criticized the Emergency Fund for denying documented crises and leaving financially insecure students without help.
I applied and provided details and proof of both incidents and was denied for both requests. They won’t tell you what constitutes an emergency and they leave students whose parents aren’t wealthy to simply fail.
r/nyu
NegativeA sophomore commuter said the NYU Promise did not cover as much tuition as they believed it promised.
However we did qualify, but I'm still paying like 7 thousand a semester to go here. Why's that? I thought it completely covered tuition not just 95% of it.
r/nyu
NegativeA transfer-support discussion criticized NYU for giving low-income transfers comparatively limited institutional support and funding opportunities.
Yet, despite that, transfers often don’t seem to receive the same level of recognition or institutional support as students who started as freshmen. For low-income transfers especially, the situation can feel discouraging.
r/nyu
NegativeA graduate student criticized a newly designed required Tandon course as excessively demanding and said its instructor had not resolved an absent group member problem.
The amount of work this class requires every week is genuinely overwhelming. I’ve been breaking down over it and it's making me struggle mentally, it’s gotten to the point where I’m questioning whether I can even continue with the program.
r/nyu
NegativeA student complained that a Core professor changed grading toward difficult exams and damaged students' academic and recruiting prospects.
He removed a 20% homework grade and placed it into exams as he believed homework’s an easy grade component. The exams are purposely made difficult.
r/nyu
NegativeA student in Steinhardt criticized disability accommodation, remote-attendance, and late-work policies as putting students' academic standing at risk during illness or bereavement.
steinhardt mpap makes it impossible for students to take care of themselves without putting their academic standings in jeopardy.
r/nyu
NegativeA freshman described an NYU dorm living situation as severely disruptive to sleep and mental health.
currently i live in a suite with 3 other people and it has been the worst experience of my life.
r/nyu

Compare New York University with another college · up to four side by side, on return and on what each place is like.

30,866Average annual costAfter grants · Family income $48k–$75k
88%Finish within six years
32,187Undergraduates
9%Applicants admitted

Where students come from

  • New Yorkin state26%
  • California11%
  • New Jersey8%
  • Texas3%
  • Outside the US25%

Share of the 5,666 students who entered as first-year undergraduates in 2024. The states shown are the three largest outside New York, so these do not add to 100%.

At a glance
SettingCity
Undergraduates?32,187
Graduate students20,913
Accepts9%
U.S. News national?#31
Admitted students who enroll?55%
WebsiteVisit nyu.edu
AdmissionsAY2024
Applicants110,807
Admitted10,232
Enrolled5,666
SAT middle 50%?1480-1560
ACT middle 50%34-35
Test scores?considered but not required
CostAY2022
Published price?$60,438
Room and board$22,786
Full year’s cost after grants, by income
Under $30k$23,476
$30k-$48k$24,529
$48k-$75k$30,866
$75k-$110k$39,359
Over $110k$55,962
Aid · AY2023
Average grant?$51,488 to 35%
Pell students?19%
Federal loan debt · October 2026
Students who borrow?17%
Owed at graduation?$19,000
Monthly, over 10 years?$216/mo
Owed if they leave early?$10,000
Outcomes2018 cohort
Graduate in 4 years76%
Graduate in 6 years88%
Return after year 1?96%
Students per faculty8:1
Most-awarded programs, bachelor'sAY2025
Management Sciences and Quantitative Methods678 degrees
Liberal Arts and Sciences General Studies and Humanities616 degrees
Computer and Information Sciences General600 degrees
Research and Experimental Psychology507 degrees
Economics496 degrees
AthleticsAY2024
DivisionNCAA Division III without football
Athletes496
Share of undergraduates?2%
StudentsAY2024
Women / men59% / 41%
International26%
White22%
Asian22%
Hispanic14%
Black7%
Two or more4%

Notes and sources

Total gain after 20 years is what a graduate is ahead at that point: what the degree pays above a high-school graduate in the same state, less four years of net price and the wages given up while studying, weighted by the share of students who finish. At this college that share is 88%, and it is the same for every program on this page because the federal data reports completion for the institution rather than for individual programs. Four-year and open-admission colleges are ranked separately and never pooled.

Annual earnings 4 years after graduation is the median earnings of that program’s graduates at that point, for students who received federal aid, and is published by program. There is no program-level cost anywhere in the federal data, so net price is the college’s figure applied to each program alike. That is sound for ordering programs against one another and should not be read as a precise figure for any one of them.

Cost on this page is always net price, never the published sticker price. Net price is the college’s full cost of attendance for a year, meaning tuition, required fees, books and supplies, and housing and food, with grant and scholarship aid from federal, state and institutional sources subtracted. Loans are not subtracted, because a loan is not a discount. It is an average for first-time full-time undergraduates receiving federal aid, reported by the college in the income bands shown, so it describes a typical family in that band rather than any particular one. A student living at home, paying out-of-state rates or holding an outside scholarship will not see this figure.

Federal loan debt comes from the College Scorecard and is a median among students who borrowed, not an average across everyone. A college where few students take loans can show a high figure and a small bill for most families, so the share who borrow is printed above it and neither should be read without the other. It counts federal student loans only: private loans and Parent PLUS borrowing are not in it and are not published anywhere comparable, which makes this a floor on what a family owes rather than a total. The figure for students who leave without finishing is the same loans without the degree they were taken for. Default rates are deliberately absent: federal repayment was suspended, so the published three-year rate is zero at almost every college in the country and says nothing about any of them.

Most-awarded programs are degrees conferred in AY2025, first majors only, so a double major counts once. Where two programs are within a few degrees of each other the order between them is not meaningful.

Quotations from students were found by a language model searching Reddit, and selected from threads discussing this college in the window shown beside them. Reddit only, so this is not a survey and not a representative sample: who posts and how much varies enormously by the size and type of a college, and for that reason nothing there is scored, totalled or compared between colleges. Post dates are the model’s own reckoning rather than a retrieved field, so treat them as inside the window and not as exact. Each quotation links to its thread.

What this college is like compares each measure against four-year colleges, because medians differ too much between sectors for a national comparison to describe anything but the sector. A position of “higher than 90%” means the college matches or beats nine in ten of them on that measure, which is why the measured figure is printed beside it. Six of those measures have a better end and carry a mark; the rest are positions with no better end and carry none. There is no overall score, because combining them would need weights and the weights would be our opinion rather than a measurement.

Sources. IPEDS, the Department of Education’s annual survey, except where stated. Each block in the column beside shows its own year, because the underlying files are released on different schedules and a single date across all of them would be false. Published tuition is a sticker price and is never used as a cost; net price is. Test scores are the middle 50% of enrolled students who submitted a score, not of admitted applicants, which is why they differ from the figures other guides print. Where a US News rank is shown it is the current edition, published as a fact about the college rather than an endorsement of the ranking.

The photograph at the top of this page was taken by a member of the public and published under a license that permits reuse with credit. It is not supplied by the college, is not endorsed by it, and shows one building on one day rather than the campus as a whole. We do not generate campus images or buy stock photographs of real places, because a picture of a campus that is not that campus is a lie about somewhere real. Full credit: “NYU07.JPG”, Jonathan71, via Wikimedia Commons. CC BY-SA 2.5. Source: https://commons.wikimedia.org/wiki/File:NYU07.JPG. License/status: https://creativecommons.org/licenses/by-sa/2.5/.

Full methodology