College Sonar
Compare collegesHow it worksFor colleges

Loading

Explore

Look up a collegeDegrees near youCompare collegesTop degrees by stateWhat colleges are like

Understand

How it worksHow badges are awarded

About

For collegesContact us

College Sonar by Optivara © 2026

University of Pittsburgh-Johnstown

Johnstown, PA

Broad access · 31 of 60 programs pay back

1,798 undergraduates, 14 students for every faculty member · Division II without football athletics

What this college is like

Best Financial Gain

Estimated over 20 years

$491k

Pharmacy Pharmaceutical Sciences and Administration

Worst Financial Gain

Estimated over 20 years

-$214k

Film/Video and Photographic Arts

Customize by family incomeUnder $30k$30k to $48k$48k to $75k$75k to $110kOver $110k
Program20 yr Financial Gain
  1. 1Pharmacy Pharmaceutical Sciences and Administration$121,958 annual earnings 4 years after graduation, a median across 116 graduates5 campuses$491k
  2. 2Computer Engineering$110,417 annual earnings 4 years after graduation, a median across 104 graduates5 campuses$395k
  3. 3Computer Science$108,680 annual earnings 4 years after graduation, a median across 266 graduates5 campuses$380k
  4. 4Electrical Electronics and Communications Engineering$102,572 annual earnings 4 years after graduation, a median across 71 graduates5 campuses$330k
  5. 5Industrial Engineering$98,654 annual earnings 4 years after graduation, a median across 66 graduates5 campuses$297k
  6. 6Chemical Engineering$97,324 annual earnings 4 years after graduation, a median across 160 graduates5 campuses$286k
  7. 7Business Administration Management and Operations$95,917 annual earnings 4 years after graduation, a median across 46 graduates5 campuses$274k
  8. 8Applied Mathematics$95,719 annual earnings 4 years after graduation, a median across 79 graduates5 campuses$273k
  9. 9Finance and Financial Management Services$95,087 annual earnings 4 years after graduation, a median across 224 graduates5 campuses$267k
  10. 10Mechanical Engineering$90,768 annual earnings 4 years after graduation, a median across 239 graduates5 campuses$232k
View all 60 programs →
  1. 11Registered Nursing Nursing Administration Nursing Research and Clinical Nursing$74,745 annual earnings 4 years after graduation, a median across 57 graduates5 campuses$213k
  2. 12Biomedical/Medical Engineering$86,893 annual earnings 4 years after graduation, a median across 59 graduates5 campuses$199k
  3. 13Health and Medical Administrative Services$83,516 annual earnings 4 years after graduation, a median across 25 graduates5 campuses$171k
  4. 14Registered Nursing Nursing Administration Nursing Research and Clinical Nursing$83,313 annual earnings 4 years after graduation, a median across 212 graduates5 campuses$170k
  5. 15Accounting and Related Services$82,966 annual earnings 4 years after graduation, a median across 233 graduates5 campuses$167k
  6. 16Information Science/Studies$81,117 annual earnings 4 years after graduation, a median across 131 graduates5 campuses$151k
  7. 17Allied Health Diagnostic Intervention and Treatment Professions$63,823 annual earnings 4 years after graduation, a median across 23 graduates5 campuses$122k
  8. 18Civil Engineering$77,608 annual earnings 4 years after graduation, a median across 118 graduates5 campuses$122k
  9. 19Economics$76,549 annual earnings 4 years after graduation, a median across 148 graduates5 campuses$113k
  10. 20Rehabilitation and Therapeutic Professions$75,950 annual earnings 4 years after graduation, a median across 151 graduates5 campuses$108k
  11. 21Mechanical Engineering Related Technologies/Technicians$75,897 annual earnings 4 years after graduation, a median across 37 graduates5 campuses$108k
  12. 22Marketing$75,461 annual earnings 4 years after graduation, a median across 228 graduates5 campuses$104k
  13. 23Dental Support Services and Allied Professions$61,404 annual earnings 4 years after graduation, a median across 48 graduates5 campuses$102k
  14. 24Chemistry$70,206 annual earnings 4 years after graduation, a median across 67 graduates5 campuses$61k
  15. 25Human Resources Management and Services$69,674 annual earnings 4 years after graduation, a median across 19 graduates5 campuses$56k
  16. 26Communication and Media Studies$69,573 annual earnings 4 years after graduation, a median across 68 graduates5 campuses$55k
  17. 27Political Science and Government$66,231 annual earnings 4 years after graduation, a median across 111 graduates5 campuses$28k
  18. 28Computer and Information Sciences General$65,892 annual earnings 4 years after graduation, a median across 40 graduates5 campuses$25k
  19. 29Neurobiology and Neurosciences$65,239 annual earnings 4 years after graduation, a median across 71 graduates5 campuses$20k
  20. 30Biochemistry Biophysics and Molecular Biology$63,707 annual earnings 4 years after graduation, a median across 24 graduates5 campuses$6,780
  21. 31Communication Disorders Sciences and Services$63,436 annual earnings 4 years after graduation, a median across 83 graduates5 campuses$4,529
  22. 32Biology General$62,744 annual earnings 4 years after graduation, a median across 229 graduates5 campuses-$1,218
  23. 33Biological and Physical Sciences$62,698 annual earnings 4 years after graduation, a median across 129 graduates5 campuses-$1,600
  24. 34Health Professions and Related Clinical Sciences Other$60,864 annual earnings 4 years after graduation, a median across 30 graduates5 campuses-$17k
  25. 35Dental Support Services and Allied Professions$60,778 annual earnings 4 years after graduation, a median across 25 graduates5 campuses-$18k
  26. 36Fine and Studio Arts$57,705 annual earnings 4 years after graduation, a median across 49 graduates5 campuses-$43k
  27. 37Business/Commerce General$57,594 annual earnings 4 years after graduation, a median across 171 graduates5 campuses-$44k
  28. 38Geological and Earth Sciences/Geosciences$57,456 annual earnings 4 years after graduation, a median across 122 graduates5 campuses-$45k
  29. 39Rhetoric and Composition/Writing Studies$57,012 annual earnings 4 years after graduation, a median across 328 graduates5 campuses-$49k
  30. 40Allied Health and Medical Assisting Services$42,748 annual earnings 4 years after graduation, a median across 29 graduates5 campuses-$53k
  31. 41Mathematics$56,143 annual earnings 4 years after graduation, a median across 30 graduates5 campuses-$56k
  32. 42Social Work$56,092 annual earnings 4 years after graduation, a median across 43 graduates5 campuses-$56k
  33. 43Romance Languages Literatures and Linguistics$56,041 annual earnings 4 years after graduation, a median across 28 graduates5 campuses-$57k
  34. 44Clinical Counseling and Applied Psychology$55,736 annual earnings 4 years after graduation, a median across 72 graduates5 campuses-$59k
  35. 45Psychology General$54,379 annual earnings 4 years after graduation, a median across 402 graduates5 campuses-$71k
  36. 46Social Sciences General$54,069 annual earnings 4 years after graduation, a median across 18 graduates5 campuses-$73k
  37. 47History$53,682 annual earnings 4 years after graduation, a median across 87 graduates5 campuses-$76k
  38. 48Criminal Justice and Corrections$52,837 annual earnings 4 years after graduation, a median across 163 graduates5 campuses-$83k
  39. 49Philosophy$52,436 annual earnings 4 years after graduation, a median across 16 graduates5 campuses-$87k
  40. 50Teacher Education and Professional Development Specific Subject Areas$52,228 annual earnings 4 years after graduation, a median across 47 graduates5 campuses-$89k
  41. 51Drama/Theatre Arts and Stagecraft$51,775 annual earnings 4 years after graduation, a median across 16 graduates5 campuses-$92k
  42. 52Sociology$51,654 annual earnings 4 years after graduation, a median across 50 graduates5 campuses-$93k
  43. 53Linguistic Comparative and Related Language Studies and Services$51,416 annual earnings 4 years after graduation, a median across 27 graduates5 campuses-$95k
  44. 54Urban Studies/Affairs$51,378 annual earnings 4 years after graduation, a median across 16 graduates5 campuses-$96k
  45. 55Anthropology$46,328 annual earnings 4 years after graduation, a median across 61 graduates5 campuses-$138k
  46. 56Literature$45,749 annual earnings 4 years after graduation, a median across 48 graduates5 campuses-$142k
  47. 57Teacher Education and Professional Development Specific Levels and Methods$45,202 annual earnings 4 years after graduation, a median across 66 graduates5 campuses-$147k
  48. 58Sports Kinesiology and Physical Education/Fitness$45,013 annual earnings 4 years after graduation, a median across 47 graduates5 campuses-$148k
  49. 59Social Sciences Other$44,520 annual earnings 4 years after graduation, a median across 19 graduates5 campuses-$153k
  50. 60Film/Video and Photographic Arts$37,066 annual earnings 4 years after graduation, a median across 26 graduates5 campuses-$214k
Other colleges to consider

Every college here returns more than this one’s best program, within 250 miles. Only 2 colleges within 50 miles return more, so the search was widened to 250 miles rather than showing you almost nothing.

Some of these admit a different share of applicants, marked on each row. A more selective college is a different application, not a free upgrade, and part of why its graduates earn more is who it admitted in the first place.

  1. 1Virginia Tech Burruss Hall from DrillfieldVirginia Polytechnic Institute and State UniversityComputer and Information Sciences General · Blacksburg · 227 mi · $144,103 annual earnings 4 years after graduation, a median across 253 graduatesadmits 40-70%$1.14M
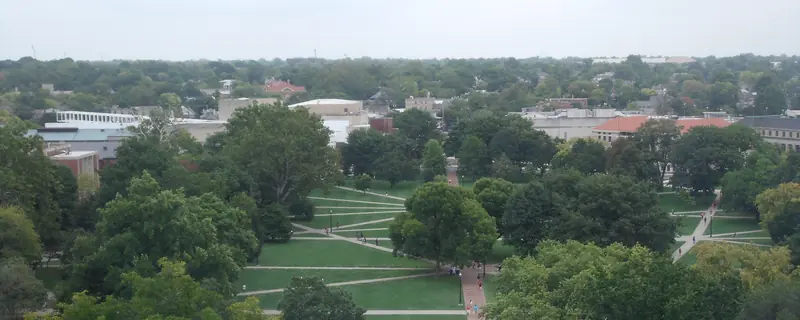
  2. 2OSU OvalOhio State University-Main CampusComputer Engineering · Columbus · 222 mi · $123,731 annual earnings 4 years after graduation, a median across 249 graduates6 campusesadmits 40-70%$917k
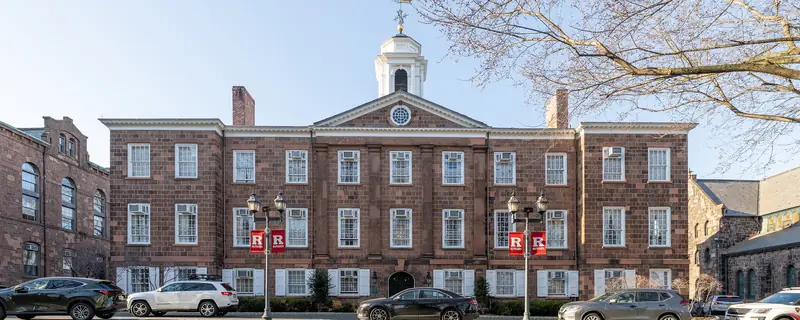
  3. 3Old Queens - Rutgers UniversityRutgers University-New BrunswickManagement Sciences and Quantitative Methods · New Brunswick · 232 mi · $126,906 annual earnings 4 years after graduation, a median across 93 graduates3 campusesadmits 40-70%$892k
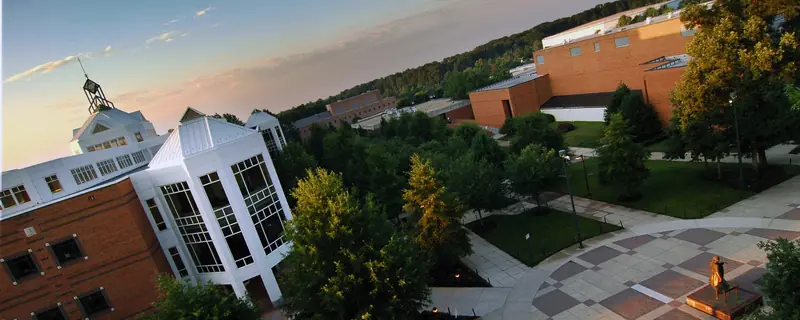
  4. 4An aerial view of the Johnson Center at dawn.George Mason UniversityHomeland Security · Fairfax · 128 mi · $143,972 annual earnings 4 years after graduation, a median across 32 graduates$849k

  5. 5Heinz Memorial Chapel, exteriorUniversity of Pittsburgh-Pittsburgh CampusPharmacy Pharmaceutical Sciences and Administration · Pittsburgh · 60 mi · $121,958 annual earnings 4 years after graduation, a median across 116 graduates5 campusesadmits 40-70%$830k
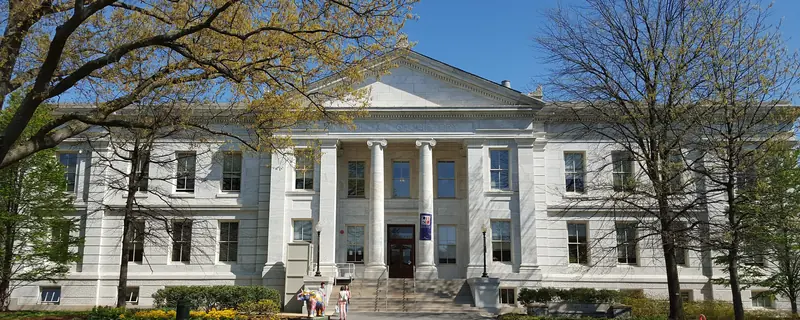
  6. 6Hurst HallAmerican UniversityFinance and Financial Management Services · Washington · 131 mi · $134,332 annual earnings 4 years after graduation, a median across 39 graduatesadmits 40-70%$818k

Campus photographs: Virginia Polytechnic Institute and State University by Eric T Gunther (CC BY 3.0); Ohio State University-Main Campus by Ibagli (Public domain); Rutgers University-New Brunswick by Ajay Suresh (CC BY 4.0); George Mason University by Photo by Nicolas Tan/Creative Services/George Mason University (CC BY-SA 4.0); University of Pittsburgh-Pittsburgh Campus by Dllu (CC BY-SA 4.0); American University by Herrperry123 (CC BY-SA 4.0)

The same programs elsewhere

Holding the subject fixed and changing the college, for this college’s three strongest programs. The list above compares whole colleges at their best; this one answers the narrower question a student who already knows their subject is actually asking.

Pharmacy Pharmaceutical Sciences and Administration16 colleges pay more
  1. 1Heinz Memorial Chapel, exteriorUniversity of Pittsburgh-Pittsburgh CampusPittsburgh · 60 mi · $121,958 annual earnings 4 years after graduation, a median across 116 graduates5 campusesadmits 40-70%$830k

  2. 2BarbelinWalkwaySaint Joseph's UniversityPhiladelphia · 191 mi · $122,633 annual earnings 4 years after graduation, a median across 227 graduates2 campuses$743k

Campus photographs: University of Pittsburgh-Pittsburgh Campus by Dllu (CC BY-SA 4.0); Saint Joseph's University by ChicagoMayne at en.wikipedia (CC BY-SA 3.0)
Computer Engineering116 colleges pay more
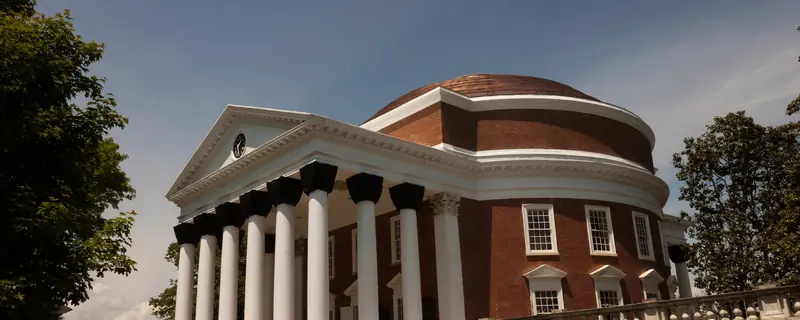
  1. 1Rotunda - University of VirginiaUniversity of Virginia-Main CampusCharlottesville · 155 mi · $148,175 annual earnings 4 years after graduation, a median across 30 graduatesadmits under 40%$1.34M
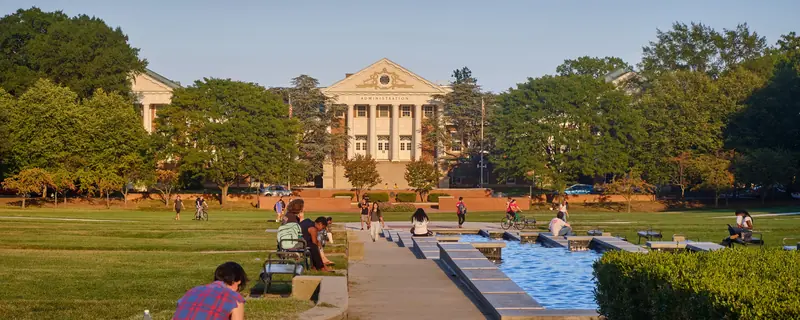
  2. 2McKeldin Mall sunset University Maryland College ParkUniversity of Maryland-College ParkCollege Park · 134 mi · $152,422 annual earnings 4 years after graduation, a median across 72 graduatesadmits 40-70%$1.28M
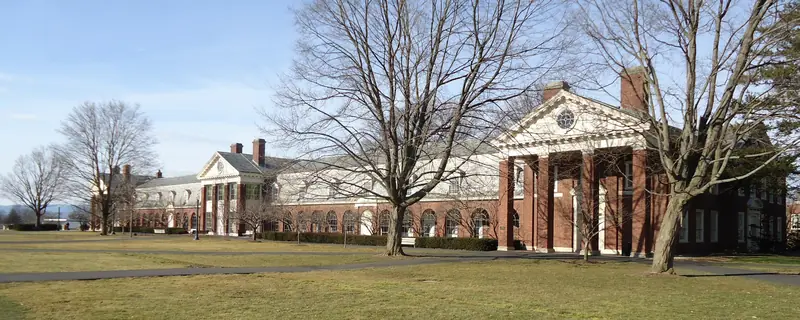
  3. 3Bucknell University 2012 20Bucknell UniversityLewisburg · 113 mi · $156,885 annual earnings 4 years after graduation, a median across 31 graduatesadmits under 40%$1.23M

Campus photographs: University of Virginia-Main Campus by Robert Emerson (CC BY-SA 3.0); University of Maryland-College Park by Blacktupelo (CC BY-SA 4.0); Bucknell University by Tomwsulcer (CC0)

Computer Science162 colleges pay more
  1. 1The Mall Carnegie MellonCarnegie Mellon UniversityPittsburgh · 60 mi · $268,121 annual earnings 4 years after graduation, a median across 121 graduatesadmits under 40%$2.91M
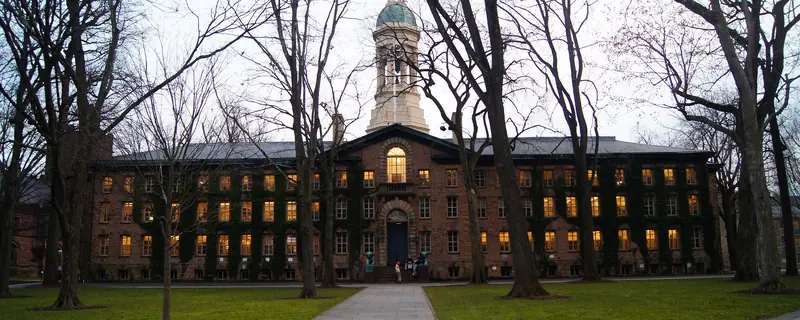
  2. 2Nassau Hall Princeton UniPrinceton UniversityPrinceton · 220 mi · $217,973 annual earnings 4 years after graduation, a median across 30 graduatesadmits under 40%$2.35M
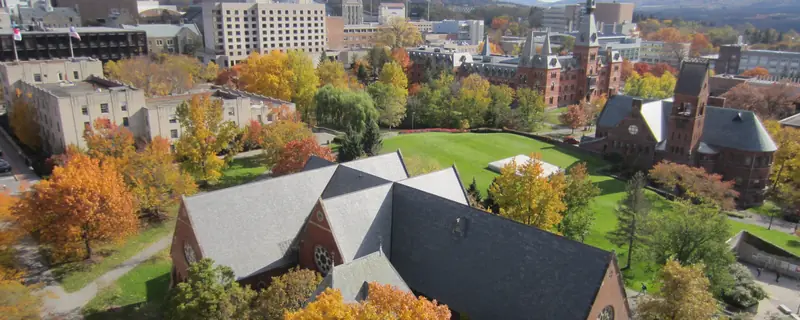
  3. 3Cornell University from McGraw TowerCornell UniversityIthaca · 194 mi · $223,309 annual earnings 4 years after graduation, a median across 296 graduates2 campusesadmits under 40%$2.34M

Campus photographs: Carnegie Mellon University by Asamudra (CC BY 3.0); Princeton University by Rohit Hirway (CC BY-SA 3.0); Cornell University by Maeshima hiroki (CC BY-SA 3.0)

Read these with care. The federal earnings data for this college is reported under an identifier shared by 5 campuses, so each figure describes those campuses together rather than this one alone.

What this college is like

Measured from federal filings, not from a survey. Each figure is compared against four-year colleges, because medians differ too much between sectors for a national comparison to describe anything but the sector.

Teaching
Students per instructor?
14:1
about typical for four-year colleges
Staying and finishing
Come back after year one?
75%
about typical for four-year colleges
Finish their credential?
38.1%
about typical for four-year colleges
Cost and aid
Yearly cost, family under $30,000?
$9,978
▲cheaper than 77% of four-year colleges
Get a grant from the college?
98%
▲a higher share than 69% of four-year colleges
Receive a Pell Grant?
34%
a lower share than 61% of four-year colleges
The campus
Undergraduates?
1,798
about typical for four-year colleges
Beds per 100 undergraduates?
102
more than 90% of four-year colleges
Study fully online?
0%
fewer than 82% of four-year colleges
Play a varsity sport?
15.9%
about typical for four-year colleges
Who else is there
Mix of student backgrounds?
51 of 100
more concentrated than 67% of four-year colleges
Choice of subject
Broad subject areas awarded?
17
about typical for four-year colleges
Also on record
Women and men
44% / 56%
reported, not ranked
Setting
Suburb
reported, not ranked
On-campus housing
Yes
residential
Athletic division
NCAA Division II without football
reported, not ranked

Compare every college in this metro

Compare University of Pittsburgh-Johnstown with another college · up to four side by side, on return and on what each place is like.

22,067Average annual costAfter grants · In-state · Family income Over $110k
56%Finish within six years
1,798Undergraduates
95%Applicants admitted

Where students come from

  • Pennsylvaniain state88%
  • Virginia2%
  • Maryland1%
  • New Jersey1%
  • Outside the US2%

Share of the 410 students who entered as first-year undergraduates in 2024. The states shown are the three largest outside Pennsylvania, so these do not add to 100%.

At a glance
SettingSuburb
Undergraduates?1,798
Accepts95%
Admitted students who enroll?18%
WebsiteVisit upj.pitt.edu
AdmissionsAY2024
Applicants2,422
Admitted2,297
Enrolled410
SAT middle 50%?985-1220
ACT middle 50%22-27
Test scores?considered but not required
CostAY2022
Published price, out of state?$26,520
Published price, in state?$14,646
Room and board$12,290
Full year’s cost after grants, by income, in state
Under $30k$9,978
$30k-$48k$11,973
$48k-$75k$17,703
$75k-$110k$22,735
Over $110k$22,067

These are in-state figures. A public college charges more to students from other states, and no out-of-state net price is published, so if you would not be a resident here, read the published prices above for the size of the difference.

Aid · AY2023
Average grant?$8,701 to 98%
Pell students?34%
Federal loan debt · October 2026
Students who borrow?56%
Owed at graduation?$23,000
Monthly, over 10 years?$261/mo
Owed if they leave early?$6,125
Outcomes2018 cohort
Graduate in 4 years38%
Graduate in 6 years56%
Return after year 1?75%
Students per faculty14:1
Most-awarded programs, bachelor'sAY2025
Teacher Education and Professional Development Specific Levels and Methods39 degrees
Mechanical Engineering34 degrees
Civil Engineering31 degrees
Computer Science27 degrees
Psychology General24 degrees
AthleticsAY2024
DivisionNCAA Division II without football
Athletes282
Share of undergraduates?16%
Athletic aid$1,948,609
StudentsAY2024
Women / men44% / 56%
White70%
Black6%
Hispanic4%
Asian4%
Two or more3%
International2%

Notes and sources

Total gain after 20 years is what a graduate is ahead at that point: what the degree pays above a high-school graduate in the same state, less four years of net price and the wages given up while studying, weighted by the share of students who finish. At this college that share is 56%, and it is the same for every program on this page because the federal data reports completion for the institution rather than for individual programs. Four-year and open-admission colleges are ranked separately and never pooled.

Annual earnings 4 years after graduation is the median earnings of that program’s graduates at that point, for students who received federal aid, and is published by program. There is no program-level cost anywhere in the federal data, so net price is the college’s figure applied to each program alike. That is sound for ordering programs against one another and should not be read as a precise figure for any one of them.

Cost on this page is always net price, never the published sticker price. Net price is the college’s full cost of attendance for a year, meaning tuition, required fees, books and supplies, and housing and food, with grant and scholarship aid from federal, state and institutional sources subtracted. Loans are not subtracted, because a loan is not a discount. It is an average for first-time full-time undergraduates receiving federal aid, reported by the college in the income bands shown, so it describes a typical family in that band rather than any particular one. A student living at home, paying out-of-state rates or holding an outside scholarship will not see this figure.

Federal loan debt comes from the College Scorecard and is a median among students who borrowed, not an average across everyone. A college where few students take loans can show a high figure and a small bill for most families, so the share who borrow is printed above it and neither should be read without the other. It counts federal student loans only: private loans and Parent PLUS borrowing are not in it and are not published anywhere comparable, which makes this a floor on what a family owes rather than a total. The figure for students who leave without finishing is the same loans without the degree they were taken for. Default rates are deliberately absent: federal repayment was suspended, so the published three-year rate is zero at almost every college in the country and says nothing about any of them.

Most-awarded programs are degrees conferred in AY2025, first majors only, so a double major counts once. Where two programs are within a few degrees of each other the order between them is not meaningful.

What this college is like compares each measure against four-year colleges, because medians differ too much between sectors for a national comparison to describe anything but the sector. A position of “higher than 90%” means the college matches or beats nine in ten of them on that measure, which is why the measured figure is printed beside it. Six of those measures have a better end and carry a mark; the rest are positions with no better end and carry none. There is no overall score, because combining them would need weights and the weights would be our opinion rather than a measurement.

Sources. IPEDS, the Department of Education’s annual survey, except where stated. Each block in the column beside shows its own year, because the underlying files are released on different schedules and a single date across all of them would be false. Published tuition is a sticker price and is never used as a cost; net price is. Test scores are the middle 50% of enrolled students who submitted a score, not of admitted applicants, which is why they differ from the figures other guides print. Where a US News rank is shown it is the current edition, published as a fact about the college rather than an endorsement of the ranking.

Full methodology