
Loading
Hampden-Sydney, VA
Competitive · 3 of 5 programs pay back
939 undergraduates, 9 students for every faculty member · 0% of undergraduates are women and 100% are men · Division III with football athletics, and 30% of undergraduates play a varsity sport
Estimated over 20 years
$212k
Business/Managerial Economics
Estimated over 20 years
-$151k
History
This college's programs pay similarly, so a single figure for the college as a whole is a fair summary of it.
Every college here returns more than this one’s best program, within 250 miles. Only 2 colleges within 50 miles return more, so the search was widened to 250 miles rather than showing you almost nothing.
Some of these admit a different share of applicants, marked on each row. A more selective college is a different application, not a free upgrade, and part of why its graduates earn more is who it admitted in the first place.
 University of Maryland-College ParkComputer Engineering · College Park · 146 mi · $152,422 annual earnings 4 years after graduation, a median across 72 graduates$1.28M
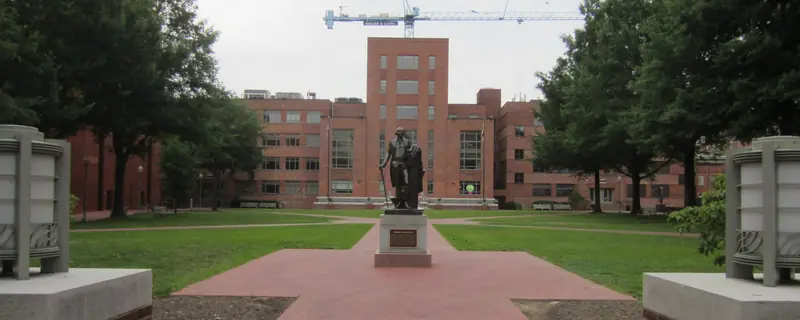 George Washington UniversityComputer Science · Washington · 138 mi · $150,716 annual earnings 4 years after graduation, a median across 40 graduates$1.15M
 Virginia Polytechnic Institute and State UniversityComputer and Information Sciences General · Blacksburg · 108 mi · $144,103 annual earnings 4 years after graduation, a median across 253 graduates$1.14M
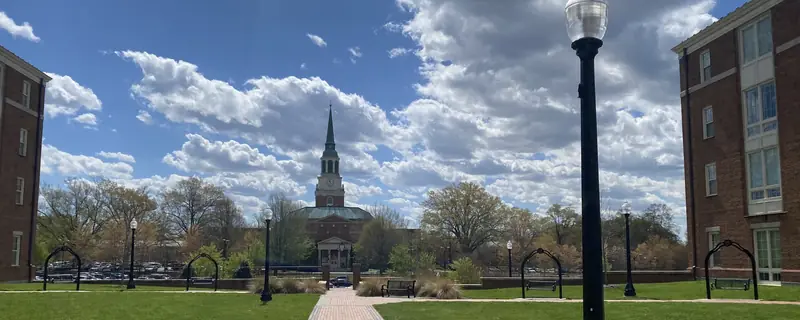 Wake Forest UniversityManagement Sciences and Quantitative Methods · Winston-Salem · 126 mi · $146,608 annual earnings 4 years after graduation, a median across 16 graduatesadmits under 40%$1.13M
 William & MaryComputer Science · Williamsburg · 97 mi · $127,851 annual earnings 4 years after graduation, a median across 48 graduatesadmits under 40%$940k
 George Mason UniversityHomeland Security · Fairfax · 127 mi · $143,972 annual earnings 4 years after graduation, a median across 32 graduatesadmits 70%+$849k
Campus photographs: University of Maryland-College Park by Blacktupelo (CC BY-SA 4.0); George Washington University by Another Believer (CC BY-SA 3.0); Virginia Polytechnic Institute and State University by Eric T Gunther (CC BY 3.0); Wake Forest University by Maggiehc23 (CC BY-SA 4.0); William & Mary by Smash the Iron Cage (CC BY-SA 4.0); George Mason University by Photo by Nicolas Tan/Creative Services/George Mason University (CC BY-SA 4.0)
Holding the subject fixed and changing the college, for this college’s three strongest programs. The list above compares whole colleges at their best; this one answers the narrower question a student who already knows their subject is actually asking.
 North Carolina State University at RaleighRaleigh · 101 mi · $82,096 annual earnings 4 years after graduation, a median across 59 graduates$408k
 Wofford CollegeSpartanburg · 250 mi · $78,906 annual earnings 4 years after graduation, a median across 40 graduates$308k
Campus photographs: North Carolina State University at Raleigh by Haruhide000 (CC BY-SA 3.0); Wofford College by Excel23 (CC BY-SA 4.0)
 Duke UniversityDurham · 90 mi · $161,149 annual earnings 4 years after graduation, a median across 116 graduatesadmits under 40%$1.49M
 Carnegie Mellon UniversityPittsburgh · 235 mi · $144,886 annual earnings 4 years after graduation, a median across 46 graduatesadmits under 40%$1.18M
 Johns Hopkins UniversityBaltimore · 176 mi · $128,882 annual earnings 4 years after graduation, a median across 60 graduatesadmits under 40%$1.06M
Campus photographs: Duke University by Warren LeMay (CC0); Carnegie Mellon University by Asamudra (CC BY 3.0); Johns Hopkins University by Daderot (Public domain)
Johns Hopkins UniversityBaltimore · 176 mi · $121,729 annual earnings 4 years after graduation, a median across 16 graduatesadmits under 40%$959k Washington and Lee UniversityLexington · 66 mi · $95,190 annual earnings 4 years after graduation, a median across 33 graduatesadmits under 40%$528kDuke UniversityDurham · 90 mi · $88,459 annual earnings 4 years after graduation, a median across 46 graduatesadmits under 40%$442k
Campus photographs: Johns Hopkins University by Daderot (Public domain); Washington and Lee University by Bobak Ha'Eri (CC BY 3.0); Duke University by Warren LeMay (CC0)
Measured from federal filings, not from a survey. Each figure is compared against four-year colleges, because medians differ too much between sectors for a national comparison to describe anything but the sector.
More than one undergraduate in five is a varsity athlete. At this level athletics shapes housing, the class schedule and who astudent will meet, whether or not they play.
Compare Hampden-Sydney College with another college · up to four side by side, on return and on what each place is like.
Share of the 295 students who entered as first-year undergraduates in 2024. The states shown are the three largest outside Virginia, so these do not add to 100%.
Total gain after 20 years is what a graduate is ahead at that point: what the degree pays above a high-school graduate in the same state, less four years of net price and the wages given up while studying, weighted by the share of students who finish. At this college that share is 62%, and it is the same for every program on this page because the federal data reports completion for the institution rather than for individual programs. Four-year and open-admission colleges are ranked separately and never pooled.
Annual earnings 4 years after graduation is the median earnings of that program’s graduates at that point, for students who received federal aid, and is published by program. There is no program-level cost anywhere in the federal data, so net price is the college’s figure applied to each program alike. That is sound for ordering programs against one another and should not be read as a precise figure for any one of them.
Cost on this page is always net price, never the published sticker price. Net price is the college’s full cost of attendance for a year, meaning tuition, required fees, books and supplies, and housing and food, with grant and scholarship aid from federal, state and institutional sources subtracted. Loans are not subtracted, because a loan is not a discount. It is an average for first-time full-time undergraduates receiving federal aid, reported by the college in the income bands shown, so it describes a typical family in that band rather than any particular one. A student living at home, paying out-of-state rates or holding an outside scholarship will not see this figure.
Federal loan debt comes from the College Scorecard and is a median among students who borrowed, not an average across everyone. A college where few students take loans can show a high figure and a small bill for most families, so the share who borrow is printed above it and neither should be read without the other. It counts federal student loans only: private loans and Parent PLUS borrowing are not in it and are not published anywhere comparable, which makes this a floor on what a family owes rather than a total. The figure for students who leave without finishing is the same loans without the degree they were taken for. Default rates are deliberately absent: federal repayment was suspended, so the published three-year rate is zero at almost every college in the country and says nothing about any of them.
Most-awarded programs are degrees conferred in AY2025, first majors only, so a double major counts once. Where two programs are within a few degrees of each other the order between them is not meaningful.
What this college is like compares each measure against four-year colleges, because medians differ too much between sectors for a national comparison to describe anything but the sector. A position of “higher than 90%” means the college matches or beats nine in ten of them on that measure, which is why the measured figure is printed beside it. Six of those measures have a better end and carry a mark; the rest are positions with no better end and carry none. There is no overall score, because combining them would need weights and the weights would be our opinion rather than a measurement.
Sources. IPEDS, the Department of Education’s annual survey, except where stated. Each block in the column beside shows its own year, because the underlying files are released on different schedules and a single date across all of them would be false. Published tuition is a sticker price and is never used as a cost; net price is. Test scores are the middle 50% of enrolled students who submitted a score, not of admitted applicants, which is why they differ from the figures other guides print. Where a US News rank is shown it is the current edition, published as a fact about the college rather than an endorsement of the ranking.
The photograph at the top of this page was taken by a member of the public and published under a license that permits reuse with credit. It is not supplied by the college, is not endorsed by it, and shows one building on one day rather than the campus as a whole. We do not generate campus images or buy stock photographs of real places, because a picture of a campus that is not that campus is a lie about somewhere real. Full credit: "Morton Hall Front Facade.jpg" by MorrisS, via Wikimedia Commons, CC BY-SA 4.0. Source: https://commons.wikimedia.org/wiki/File:Morton_Hall_Front_Facade.jpg. License/status: https://creativecommons.org/licenses/by-sa/4.0.