College Sonar
Compare collegesHow it worksFor colleges

Loading

Explore

Look up a collegeDegrees near youCompare collegesTop degrees by stateWhat colleges are like

Understand

How it worksHow badges are awarded

About

For collegesContact us

College Sonar by Optivara © 2026

Virginia Polytechnic Institute and State University

Blacksburg, VA

Photo: Eric T Gunther · CC BY 3.0

Competitive · 57 of 60 programs pay back

32,242 undergraduates, 17 students for every faculty member · Division I-FBS athletics

What this college is like

Best Financial Gain

Estimated over 20 years

$1.17M

Computer and Information Sciences General

Worst Financial Gain

Estimated over 20 years

-$72k

Animal Sciences

Customize by family incomeUnder $30k$30k to $48k$48k to $75k$75k to $110kOver $110k
Program20 yr Financial Gain
  1. 1Computer and Information Sciences General$144,103 annual earnings 4 years after graduation, a median across 253 graduates$1.17M
  2. 2Computer Engineering$122,026 annual earnings 4 years after graduation, a median across 139 graduates$888k
  3. 3Applied Mathematics$117,990 annual earnings 4 years after graduation, a median across 65 graduates$836k
  4. 4Industrial Engineering$116,641 annual earnings 4 years after graduation, a median across 113 graduates$818k
  5. 5Management Sciences and Quantitative Methods$108,726 annual earnings 4 years after graduation, a median across 346 graduates$717k
  6. 6Aerospace Aeronautical and Astronautical/Space Engineering$106,633 annual earnings 4 years after graduation, a median across 89 graduates$690k
  7. 7Chemical Engineering$106,011 annual earnings 4 years after graduation, a median across 80 graduates$682k
  8. 8Electrical Electronics and Communications Engineering$104,839 annual earnings 4 years after graduation, a median across 122 graduates$667k
  9. 9Finance and Financial Management Services$102,902 annual earnings 4 years after graduation, a median across 258 graduates$642k
  10. 10Construction Engineering$102,699 annual earnings 4 years after graduation, a median across 46 graduates$640k
View all 60 programs →
  1. 11Engineering Mechanics$101,509 annual earnings 4 years after graduation, a median across 36 graduates$624k
  2. 12Accounting and Related Services$99,528 annual earnings 4 years after graduation, a median across 164 graduates$599k
  3. 13Mechanical Engineering$96,376 annual earnings 4 years after graduation, a median across 286 graduates$559k
  4. 14Real Estate$95,576 annual earnings 4 years after graduation, a median across 53 graduates$548k
  5. 15Construction Management$95,165 annual earnings 4 years after graduation, a median across 106 graduates$543k
  6. 16Mining and Mineral Engineering$94,397 annual earnings 4 years after graduation, a median across 32 graduates$533k
  7. 17Statistics$94,300 annual earnings 4 years after graduation, a median across 26 graduates$532k
  8. 18Physics$92,746 annual earnings 4 years after graduation, a median across 42 graduates$512k
  9. 19Economics$92,653 annual earnings 4 years after graduation, a median across 106 graduates$511k
  10. 20Materials Engineering$90,828 annual earnings 4 years after graduation, a median across 65 graduates$487k
  11. 21Agricultural Engineering$88,315 annual earnings 4 years after graduation, a median across 49 graduates$455k
  12. 22Civil Engineering$88,142 annual earnings 4 years after graduation, a median across 208 graduates$453k
  13. 23Marketing$86,338 annual earnings 4 years after graduation, a median across 175 graduates$430k
  14. 24Engineering-Related Fields$81,618 annual earnings 4 years after graduation, a median across 36 graduates$369k
  15. 25Food Science and Technology$80,161 annual earnings 4 years after graduation, a median across 41 graduates$351k
  16. 26Business Administration Management and Operations$80,023 annual earnings 4 years after graduation, a median across 145 graduates$349k
  17. 27Political Science and Government$75,687 annual earnings 4 years after graduation, a median across 186 graduates$293k
  18. 28Architecture$75,074 annual earnings 4 years after graduation, a median across 91 graduates$285k
  19. 29Foods Nutrition and Related Services$74,005 annual earnings 4 years after graduation, a median across 172 graduates$272k
  20. 30Chemistry$73,395 annual earnings 4 years after graduation, a median across 22 graduates$264k
  21. 31Hospitality Administration/Management$72,817 annual earnings 4 years after graduation, a median across 56 graduates$256k
  22. 32Design and Applied Arts$72,213 annual earnings 4 years after graduation, a median across 65 graduates$249k
  23. 33International Relations and National Security Studies$71,988 annual earnings 4 years after graduation, a median across 95 graduates$246k
  24. 34Linguistic Comparative and Related Language Studies and Services$68,263 annual earnings 4 years after graduation, a median across 76 graduates$198k
  25. 35Atmospheric Sciences and Meteorology$67,892 annual earnings 4 years after graduation, a median across 28 graduates$193k
  26. 36Mathematics$67,763 annual earnings 4 years after graduation, a median across 71 graduates$191k
  27. 37Biochemistry Biophysics and Molecular Biology$67,621 annual earnings 4 years after graduation, a median across 57 graduates$190k
  28. 38Microbiological Sciences and Immunology$67,253 annual earnings 4 years after graduation, a median across 16 graduates$185k
  29. 39Public Policy Analysis$66,177 annual earnings 4 years after graduation, a median across 19 graduates$171k
  30. 40Communication and Media Studies$66,106 annual earnings 4 years after graduation, a median across 215 graduates$170k
  31. 41Geography and Cartography$65,259 annual earnings 4 years after graduation, a median across 48 graduates$159k
  32. 42Family and Consumer Sciences/Human Sciences Business Services$65,248 annual earnings 4 years after graduation, a median across 95 graduates$159k
  33. 43English Language and Literature General$64,225 annual earnings 4 years after graduation, a median across 98 graduates$146k
  34. 44Forestry$64,204 annual earnings 4 years after graduation, a median across 88 graduates$146k
  35. 45Sociology$63,654 annual earnings 4 years after graduation, a median across 109 graduates$139k
  36. 46Agricultural Business and Management$62,398 annual earnings 4 years after graduation, a median across 43 graduates$123k
  37. 47Biology General$61,703 annual earnings 4 years after graduation, a median across 137 graduates$114k
  38. 48Geological and Earth Sciences/Geosciences$59,969 annual earnings 4 years after graduation, a median across 19 graduates$92k
  39. 49Natural Resources Conservation and Research$59,868 annual earnings 4 years after graduation, a median across 49 graduates$90k
  40. 50History$59,819 annual earnings 4 years after graduation, a median across 52 graduates$90k
  41. 51Neurobiology and Neurosciences$59,714 annual earnings 4 years after graduation, a median across 63 graduates$88k
  42. 52Fine and Studio Arts$58,652 annual earnings 4 years after graduation, a median across 54 graduates$75k
  43. 53Human Development Family Studies and Related Services$58,340 annual earnings 4 years after graduation, a median across 218 graduates$71k
  44. 54Plant Sciences$56,630 annual earnings 4 years after graduation, a median across 49 graduates$49k
  45. 55Psychology General$56,365 annual earnings 4 years after graduation, a median across 170 graduates$45k
  46. 56Agricultural Production Operations$46,669 annual earnings 4 years after graduation, a median across 62 graduates$29k
  47. 57Agriculture General$53,568 annual earnings 4 years after graduation, a median across 18 graduates$9,412
  48. 58Music$48,028 annual earnings 4 years after graduation, a median across 23 graduates-$62k
  49. 59Wildlife and Wildlands Science and Management$47,496 annual earnings 4 years after graduation, a median across 54 graduates-$68k
  50. 60Animal Sciences$47,224 annual earnings 4 years after graduation, a median across 115 graduates-$72k
Other colleges to consider

Every college here returns more than this one’s best program, within 250 miles. Nothing within 50 miles returns more, so the search was widened to 250 miles rather than showing you almost nothing.

Colleges of comparable difficulty come first here. Any that admit far fewer applicants than this one sit below them and are marked with what they admit. A more selective college is a different application, not a free upgrade, and part of why its graduates earn more is who it admitted in the first place.
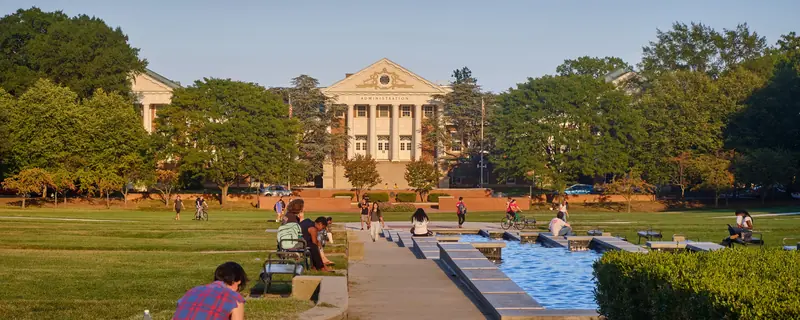
  1. 1McKeldin Mall sunset University Maryland College ParkUniversity of Maryland-College ParkComputer Engineering · College Park · 225 mi · $152,422 annual earnings 4 years after graduation, a median across 72 graduates$1.31M
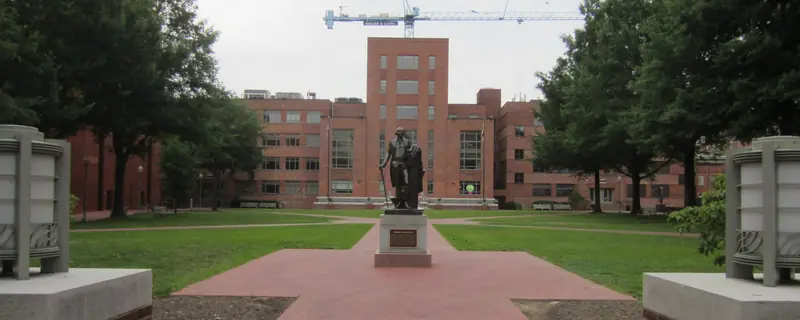
  2. 2University Yard, George Washington University, 2012George Washington UniversityComputer Science · Washington · 217 mi · $150,716 annual earnings 4 years after graduation, a median across 40 graduates$1.23M

Campus photographs: University of Maryland-College Park by Blacktupelo (CC BY-SA 4.0); George Washington University by Another Believer (CC BY-SA 3.0)

Harder to get into than this college, by the same measure
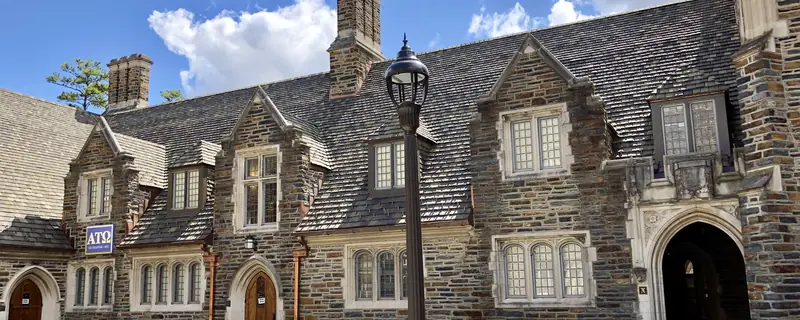
  1. 3Craven Quad, West Campus, Duke University, Durham, NCDuke UniversityMathematics · Durham · 118 mi · $297,029 annual earnings 4 years after graduation, a median across 17 graduatesadmits 6%$3.60M

  2. 4The Mall Carnegie MellonCarnegie Mellon UniversityComputer Science · Pittsburgh · 224 mi · $268,121 annual earnings 4 years after graduation, a median across 121 graduatesadmits 12%$3.04M

  3. 5Healy Hall, entrance - Georgetown UniversityGeorgetown UniversityInternational Business · Washington · 216 mi · $159,452 annual earnings 4 years after graduation, a median across 42 graduatesadmits 13%$1.58M
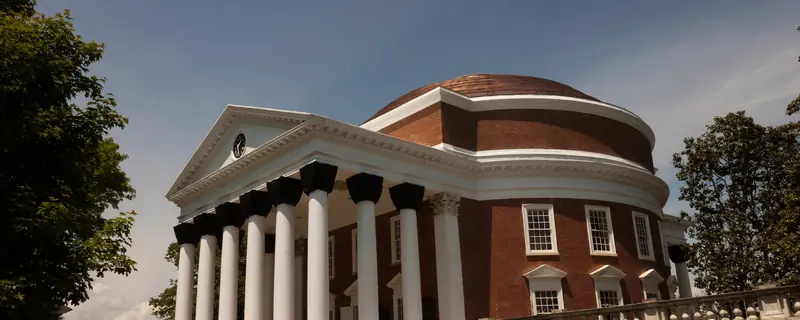
  4. 6Rotunda - University of VirginiaUniversity of Virginia-Main CampusComputer Engineering · Charlottesville · 119 mi · $148,175 annual earnings 4 years after graduation, a median across 30 graduatesadmits 17%$1.39M

Campus photographs: Duke University by Warren LeMay (CC0); Carnegie Mellon University by Asamudra (CC BY 3.0); Georgetown University by AgnosticPreachersKid (CC BY-SA 3.0); University of Virginia-Main Campus by Robert Emerson (CC BY-SA 3.0)

The same programs elsewhere

Holding the subject fixed and changing the college, for this college’s three strongest programs. The list above compares whole colleges at their best; this one answers the narrower question a student who already knows their subject is actually asking.

Computer and Information Sciences General17 colleges pay more
  1. 1The Mall Carnegie MellonCarnegie Mellon UniversityPittsburgh · 224 mi · $187,437 annual earnings 4 years after graduation, a median across 43 graduatesadmits under 40%$1.91M
  2. 2Rotunda - University of VirginiaUniversity of Virginia-Main CampusCharlottesville · 119 mi · $142,041 annual earnings 4 years after graduation, a median across 201 graduatesadmits under 40%$1.31M
  3. 3McKeldin Mall sunset University Maryland College ParkUniversity of Maryland-College ParkCollege Park · 225 mi · $144,501 annual earnings 4 years after graduation, a median across 188 graduates$1.21M

Campus photographs: Carnegie Mellon University by Asamudra (CC BY 3.0); University of Virginia-Main Campus by Robert Emerson (CC BY-SA 3.0); University of Maryland-College Park by Blacktupelo (CC BY-SA 4.0)
Computer Engineering30 colleges pay more
  1. 1Craven Quad, West Campus, Duke University, Durham, NCDuke UniversityDurham · 118 mi · $174,522 annual earnings 4 years after graduation, a median across 73 graduatesadmits under 40%$1.83M
  2. 2Rotunda - University of VirginiaUniversity of Virginia-Main CampusCharlottesville · 119 mi · $148,175 annual earnings 4 years after graduation, a median across 30 graduatesadmits under 40%$1.39M
  3. 3McKeldin Mall sunset University Maryland College ParkUniversity of Maryland-College ParkCollege Park · 225 mi · $152,422 annual earnings 4 years after graduation, a median across 72 graduates$1.31M

Campus photographs: Duke University by Warren LeMay (CC0); University of Virginia-Main Campus by Robert Emerson (CC BY-SA 3.0); University of Maryland-College Park by Blacktupelo (CC BY-SA 4.0)

Applied Mathematics7 colleges pay more
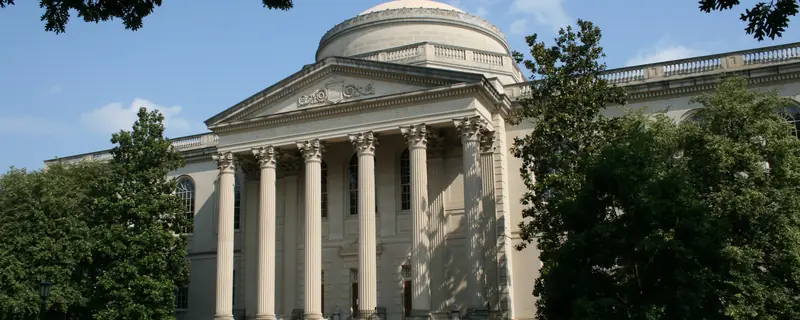
  1. 12008-07-11 UNC-CH Wilson Library 1University of North Carolina at Chapel HillChapel Hill · 119 mi · $119,839 annual earnings 4 years after graduation, a median across 105 graduatesadmits under 40%$1.01M
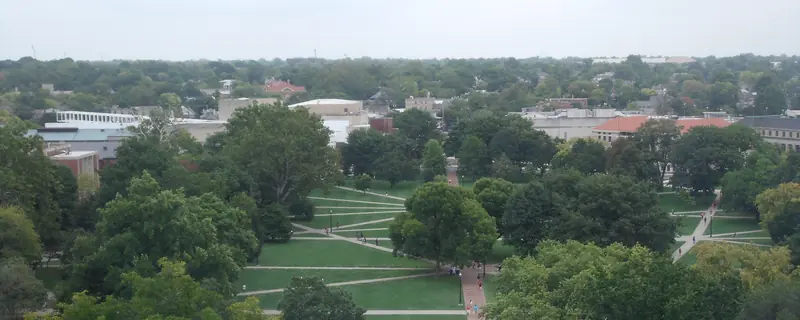
  2. 2OSU OvalOhio State University-Main CampusColumbus · 237 mi · $120,495 annual earnings 4 years after graduation, a median across 21 graduates6 campuses$921k

Campus photographs: University of North Carolina at Chapel Hill by Ildar Sagdejev / Specious (CC BY-SA 3.0); Ohio State University-Main Campus by Ibagli (Public domain)

What this college is like

Measured from federal filings, not from a survey. Each figure is compared against four-year colleges, because medians differ too much between sectors for a national comparison to describe anything but the sector.

Teaching
Students per instructor?
17:1
▼more students per instructor than 76% of four-year colleges
Staying and finishing
Come back after year one?
93%
▲higher than 92% of four-year colleges
Finish their credential?
68.5%
▲higher than 87% of four-year colleges
Cost and aid
Yearly cost, family under $30,000?
$11,740
▲cheaper than 67% of four-year colleges
Get a grant from the college?
60%
▼a lower share than 77% of four-year colleges
Receive a Pell Grant?
15%
a lower share than 94% of four-year colleges
The campus
Undergraduates?
32,242
larger than 98% of four-year colleges
Beds per 100 undergraduates?
32
fewer than 79% of four-year colleges
Study fully online?
0.5%
fewer than 74% of four-year colleges
Graduate students, share of enrollment?
17.2%
more than 57% of four-year colleges
Play a varsity sport?
2.1%
fewer than 95% of four-year colleges
Who else is there
Mix of student backgrounds?
64 of 100
more varied than 58% of four-year colleges
Choice of subject
Broad subject areas awarded?
26
▲more than 95% of four-year colleges
Also on record
Women and men
43% / 57%
reported, not ranked
Setting
City
reported, not ranked
On-campus housing
Yes
residential
Athletic division
NCAA Division I-FBS
reported, not ranked

Compare every college in this metro

What students are saying

Students and recent alumni of Virginia Polytechnic Institute and State University, in their own words, on Reddit. Every quotation links to the thread it came from.

What came up most

several threads · August to October 2026
MixedHokie football, tickets, game results, and the Lane Stadium experience, was a frequent topic, with discussion mixed between excitement and criticism.
The new lights are amazing. The ability to instantly turn them on and off and change colors creates a really cool effect.
r/VirginiaTech
NeutralAdmissions prospects, applicant qualifications, and application procedures were a common mostly neutral information-seeking topic.
Every year, we get thousands of posts and comments from prospective students about applications, many of whom have similar or identical stats.
r/VirginiaTech
MixedFirst-year adjustment and making friends were discussed often, with a mixed tone of student loneliness and supportive advice.
So first week of college is over. Haven’t really made any friends or anything.
r/VirginiaTech · this quotation is the post title
NegativeWhether freshmen should commute or live on campus was a recurring topic, discussed mostly negatively toward commuting because of social and practical drawbacks.
I can say from experience, not living on campus or near campus your first year, you will miss out on a lot of opportunities.
r/VirginiaTech
PositiveCampus and Hokie community events, including pre-game activities, were discussed in a mostly positive and promotional way.
The bigger goal: I want to make this a regular thing the day before home game days, just a spot to hang out and get hyped before the weekend.
r/VirginiaTech

Changes and news students discussed

several threads · August to October 2026
NegativeStudents discussed a new swipe-based dining-plan system that they said overloaded Owens and D2 dining halls.
Virginia Tech dining was utterly unprepared for this dining plan change. The change basically sends everyone to D2 and Owen’s for everything.
r/VirginiaTech
NegativeA post reported that the graduate-student childcare program, Little Hokie Hangout, was being ended because of changed financial priorities.
After months of discussing budgets, the decision was made to end the childcare program in large part due to changing financial priorities.
r/VirginiaTech
NeutralFootball discussion identified a new head coach as a notable change ahead of the season.
We have a new head coach
r/VirginiaTech
NegativeA Reddit user raised concerns that overenrollment was placing some first-year students in off-campus housing.
VT has a growing overenrollment problem and it's pushing a ton of people off-campus.
r/VirginiaTech

Compare Virginia Polytechnic Institute and State University with another college · up to four side by side, on return and on what each place is like.

18,113Average annual costAfter grants · In-state · Family income $48k–$75k
86%Finish within six years
32,242Undergraduates
55%Applicants admitted

Where students come from

  • Virginiain state61%
  • New Jersey6%
  • Maryland5%
  • North Carolina4%
  • Outside the US5%

Share of the 7,289 students who entered as first-year undergraduates in 2024. The states shown are the three largest outside Virginia, so these do not add to 100%.

At a glance
SettingCity
Undergraduates?32,242
Graduate students6,677
Accepts55%
U.S. News national?#52
Admitted students who enroll?25%
WebsiteVisit vt.edu
AdmissionsAY2024
Applicants52,498
Admitted28,758
Enrolled7,289
SAT middle 50%?1280-1450
ACT middle 50%28-32
Test scores?considered but not required
CostAY2022
Published price, out of state?$36,694
Published price, in state?$16,082
Room and board$14,888
Full year’s cost after grants, by income, in state
Under $30k$11,740
$30k-$48k$13,739
$48k-$75k$18,113
$75k-$110k$24,065
Over $110k$26,726

These are in-state figures. A public college charges more to students from other states, and no out-of-state net price is published, so if you would not be a resident here, read the published prices above for the size of the difference.

Aid · AY2023
Average grant?$6,031 to 60%
Pell students?15%
Federal loan debt · October 2026
Students who borrow?33%
Owed at graduation?$20,500
Monthly, over 10 years?$233/mo
Owed if they leave early?$8,250
Outcomes2018 cohort
Graduate in 4 years68%
Graduate in 6 years86%
Return after year 1?93%
Students per faculty17:1
Most-awarded programs, bachelor'sAY2025
Management Sciences and Quantitative Methods610 degrees
Computer and Information Sciences General527 degrees
Finance and Financial Management Services356 degrees
Mechanical Engineering310 degrees
Communication and Media Studies293 degrees
AthleticsAY2024
DivisionNCAA Division I-FBS
Athletes618
Share of undergraduates?2%
Athletic aid$20,853,299
StudentsAY2024
Women / men43% / 57%
White57%
Asian14%
Hispanic10%
Black6%
Two or more6%
International5%

Notes and sources

Total gain after 20 years is what a graduate is ahead at that point: what the degree pays above a high-school graduate in the same state, less four years of net price and the wages given up while studying, weighted by the share of students who finish. At this college that share is 86%, and it is the same for every program on this page because the federal data reports completion for the institution rather than for individual programs. Four-year and open-admission colleges are ranked separately and never pooled.

Annual earnings 4 years after graduation is the median earnings of that program’s graduates at that point, for students who received federal aid, and is published by program. There is no program-level cost anywhere in the federal data, so net price is the college’s figure applied to each program alike. That is sound for ordering programs against one another and should not be read as a precise figure for any one of them.

Cost on this page is always net price, never the published sticker price. Net price is the college’s full cost of attendance for a year, meaning tuition, required fees, books and supplies, and housing and food, with grant and scholarship aid from federal, state and institutional sources subtracted. Loans are not subtracted, because a loan is not a discount. It is an average for first-time full-time undergraduates receiving federal aid, reported by the college in the income bands shown, so it describes a typical family in that band rather than any particular one. A student living at home, paying out-of-state rates or holding an outside scholarship will not see this figure.

Federal loan debt comes from the College Scorecard and is a median among students who borrowed, not an average across everyone. A college where few students take loans can show a high figure and a small bill for most families, so the share who borrow is printed above it and neither should be read without the other. It counts federal student loans only: private loans and Parent PLUS borrowing are not in it and are not published anywhere comparable, which makes this a floor on what a family owes rather than a total. The figure for students who leave without finishing is the same loans without the degree they were taken for. Default rates are deliberately absent: federal repayment was suspended, so the published three-year rate is zero at almost every college in the country and says nothing about any of them.

Most-awarded programs are degrees conferred in AY2025, first majors only, so a double major counts once. Where two programs are within a few degrees of each other the order between them is not meaningful.

Quotations from students were found by a language model searching Reddit, and selected from threads discussing this college in the window shown beside them. Reddit only, so this is not a survey and not a representative sample: who posts and how much varies enormously by the size and type of a college, and for that reason nothing there is scored, totalled or compared between colleges. Post dates are the model’s own reckoning rather than a retrieved field, so treat them as inside the window and not as exact. Each quotation links to its thread.

What this college is like compares each measure against four-year colleges, because medians differ too much between sectors for a national comparison to describe anything but the sector. A position of “higher than 90%” means the college matches or beats nine in ten of them on that measure, which is why the measured figure is printed beside it. Six of those measures have a better end and carry a mark; the rest are positions with no better end and carry none. There is no overall score, because combining them would need weights and the weights would be our opinion rather than a measurement.

Sources. IPEDS, the Department of Education’s annual survey, except where stated. Each block in the column beside shows its own year, because the underlying files are released on different schedules and a single date across all of them would be false. Published tuition is a sticker price and is never used as a cost; net price is. Test scores are the middle 50% of enrolled students who submitted a score, not of admitted applicants, which is why they differ from the figures other guides print. Where a US News rank is shown it is the current edition, published as a fact about the college rather than an endorsement of the ranking.

The photograph at the top of this page was taken by a member of the public and published under a license that permits reuse with credit. It is not supplied by the college, is not endorsed by it, and shows one building on one day rather than the campus as a whole. We do not generate campus images or buy stock photographs of real places, because a picture of a campus that is not that campus is a lie about somewhere real. Full credit: “Virginia Tech Burruss Hall from Drillfield.JPG”, Eric T Gunther, via Wikimedia Commons. CC BY 3.0. Source: https://commons.wikimedia.org/wiki/File:Virginia_Tech_Burruss_Hall_from_Drillfield.JPG. License/status: https://creativecommons.org/licenses/by/3.0/.

Full methodology