
Loading
Stanford, CA
Selective · 9 of 10 programs pay back
8,171 undergraduates, 6 students for every faculty member · Division I-FBS athletics · Graduate students are 48% of total enrollment
Estimated over 20 years
$2.30M
Computer Science
Estimated over 20 years
-$17k
Ethnic Cultural Minority Gender and Group Studies
This college’s best program returns more than any other within 250 miles, so these are the next strongest options rather than higher-returning ones. Only 38% of students here come from CA, so the search is wider than the usual 50 miles: for a college people travel to, the colleges down the road are not the real alternatives.
Some of these admit a different share of applicants, marked on each row. A more selective college is a different application, not a free upgrade, and part of why its graduates earn more is who it admitted in the first place.
 University of California-BerkeleyComputer Science · Berkeley · 31 mi · $204,379 annual earnings 4 years after graduation, a median across 304 graduates$2.12M
 Santa Clara UniversityComputer Engineering · Santa Clara · 14 mi · $163,765 annual earnings 4 years after graduation, a median across 69 graduatesadmits 40-70%$1.42M
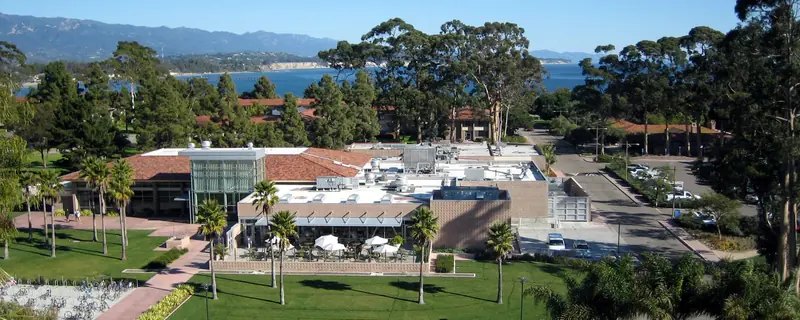 University of California-Santa BarbaraComputer Science · Santa Barbara · 245 mi · $149,190 annual earnings 4 years after graduation, a median across 90 graduates$1.19M
 University of California-DavisComputer Engineering · Davis · 80 mi · $145,422 annual earnings 4 years after graduation, a median across 103 graduatesadmits 40-70%$1.19M
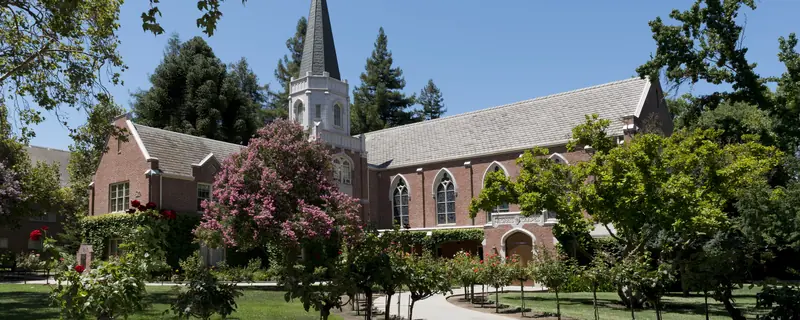 University of the PacificMulti/Interdisciplinary Studies Other · Stockton · 60 mi · $171,261 annual earnings 4 years after graduation, a median across 95 graduatesadmits 70%+$1.19M
Campus photographs: University of California-Berkeley by Franco Folini (CC BY-SA 2.0); Santa Clara University by JaGa; brightness adjustment by Carschten (CC BY-SA 3.0); University of California-Santa Barbara by Carl Jantzen from Santa Barbara, California, United States of America (CC BY-SA 2.0); University of California-Davis by Borawik (CC BY-SA 4.0); University of the Pacific by Carol M. Highsmith (Public domain)
Holding the subject fixed and changing the college, for this college’s three strongest programs. The list above compares whole colleges at their best; this one answers the narrower question a student who already knows their subject is actually asking.
 Carnegie Mellon UniversityPittsburgh · 2257 mi · $268,121 annual earnings 4 years after graduation, a median across 121 graduates$3.04M
 Massachusetts Institute of TechnologyCambridge · 2688 mi · $225,141 annual earnings 4 years after graduation, a median across 213 graduates$2.62M
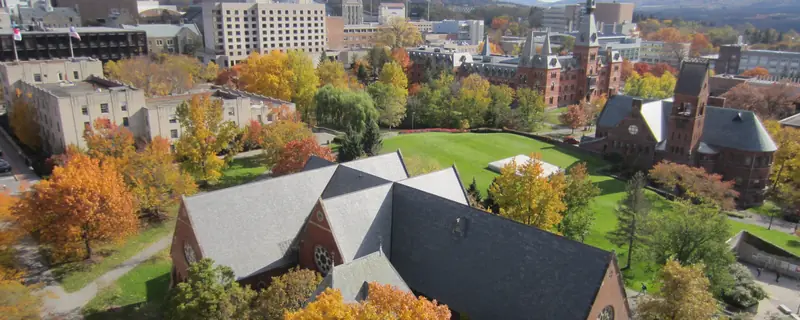 Cornell UniversityIthaca · 2416 mi · $223,309 annual earnings 4 years after graduation, a median across 296 graduates2 campuses$2.52M
Campus photographs: Carnegie Mellon University by Asamudra (CC BY 3.0); Massachusetts Institute of Technology by Peacearth (CC BY-SA 4.0); Cornell University by Maeshima hiroki (CC BY-SA 3.0)
Carnegie Mellon UniversityPittsburgh · 2257 mi · $162,106 annual earnings 4 years after graduation, a median across 16 graduates$1.55MCampus photograph: Carnegie Mellon University by Asamudra (CC BY 3.0)
Massachusetts Institute of TechnologyCambridge · 2688 mi · $131,967 annual earnings 4 years after graduation, a median across 122 graduates$1.29M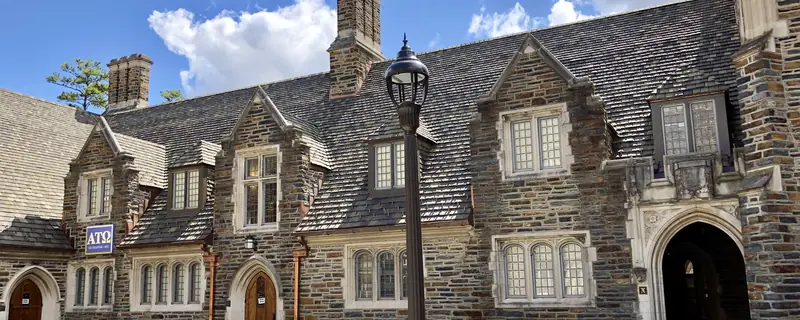 Duke UniversityDurham · 2375 mi · $120,991 annual earnings 4 years after graduation, a median across 50 graduates$1.06M
 Princeton UniversityPrinceton · 2532 mi · $115,927 annual earnings 4 years after graduation, a median across 24 graduates$1.01M
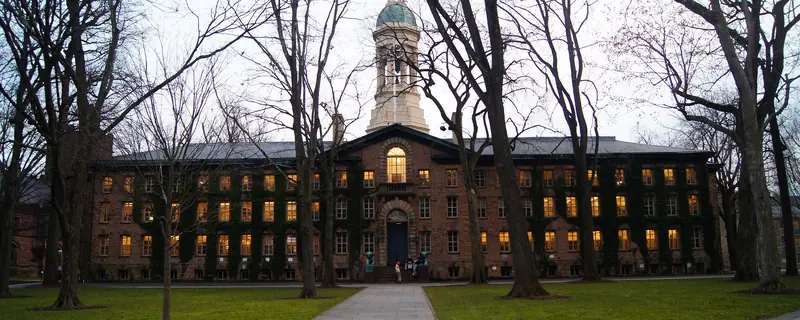
Campus photographs: Massachusetts Institute of Technology by Peacearth (CC BY-SA 4.0); Duke University by Warren LeMay (CC0); Princeton University by Rohit Hirway (CC BY-SA 3.0)
Measured from federal filings, not from a survey. Each figure is compared against four-year colleges, because medians differ too much between sectors for a national comparison to describe anything but the sector.
Students and recent alumni of Stanford University, in their own words, on Reddit. Every quotation links to the thread it came from.
I feel like my schedule is probably too heavy, but yall lmk.r/stanford
Having just recently moved here, no you will not be able to find a (decent) studio for $2000 in Palo Alto. For Oak Creek (the Stanford postdoc housing), it can take over a year to get off the waitlist so add yourself ASAP even if you aren’t sure yet if would want to live there.r/stanford
It’s been AMAZING and a dream come true: I love the campus, the school and the people. However, I can’t help but feel homesick. I’m scared to admit it but I’m quite overwhelmed and intimidated.r/stanford
I’ll never be able to walk through Coho and say hi to ten people I know and bike five minutes to hang out with a friend in the middle of the day for hours and just have so much freedom and agency over what I do with my time.r/stanford
It’s been AMAZING and a dream come true: I love the campus, the school and the people.r/stanford
CA weather matters so much, the sun is out now and everyone is clearly happy to bask in it. We have a biking culture so you’ll definitely love it. Access to research, medical extracurriculars and top professors for networking is actually insane here, you can easily join a lab your freshman fall, which is what I did.r/stanford
The premed culture here is not insanely toxic, and most people I’ve met are nice and want you to succeed. Stanford has a lot of concentrations within each major for you to expand on your interests, so you’ll get a lot of exposure to various fields.r/stanford
There have been SO many opportunities that I have had, solely due to being in the Stanford social network. I started a non-profit while in school with my Stanford friends. My current job, in the bay, which I LOVE was through a referral from a friend from Stanford.r/stanford
Spent all my time outdoors — hiking, surfing, running, swimming, and hanging on the lawns — spikeball, volleyball, beer dye, grilling, etc.r/stanford
Take ARTHIST 119: Love at first sight. Best class I’ve taken, changed my life. Emanuele Lugli is a great lecturerr/stanford
Compare Stanford University with another college · up to four side by side, on return and on what each place is like.
Share of the 1,693 students who entered as first-year undergraduates in 2024. The states shown are the three largest outside California, so these do not add to 100%.
Total gain after 20 years is what a graduate is ahead at that point: what the degree pays above a high-school graduate in the same state, less four years of net price and the wages given up while studying, weighted by the share of students who finish. At this college that share is 92%, and it is the same for every program on this page because the federal data reports completion for the institution rather than for individual programs. Four-year and open-admission colleges are ranked separately and never pooled.
Annual earnings 4 years after graduation is the median earnings of that program’s graduates at that point, for students who received federal aid, and is published by program. There is no program-level cost anywhere in the federal data, so net price is the college’s figure applied to each program alike. That is sound for ordering programs against one another and should not be read as a precise figure for any one of them.
Cost on this page is always net price, never the published sticker price. Net price is the college’s full cost of attendance for a year, meaning tuition, required fees, books and supplies, and housing and food, with grant and scholarship aid from federal, state and institutional sources subtracted. Loans are not subtracted, because a loan is not a discount. It is an average for first-time full-time undergraduates receiving federal aid, reported by the college in the income bands shown, so it describes a typical family in that band rather than any particular one. A student living at home, paying out-of-state rates or holding an outside scholarship will not see this figure.
Federal loan debt comes from the College Scorecard and is a median among students who borrowed, not an average across everyone. A college where few students take loans can show a high figure and a small bill for most families, so the share who borrow is printed above it and neither should be read without the other. It counts federal student loans only: private loans and Parent PLUS borrowing are not in it and are not published anywhere comparable, which makes this a floor on what a family owes rather than a total. The figure for students who leave without finishing is the same loans without the degree they were taken for. Default rates are deliberately absent: federal repayment was suspended, so the published three-year rate is zero at almost every college in the country and says nothing about any of them.
Most-awarded programs are degrees conferred in AY2025, first majors only, so a double major counts once. Where two programs are within a few degrees of each other the order between them is not meaningful.
Quotations from students were found by a language model searching Reddit, and selected from threads discussing this college in the window shown beside them. Reddit only, so this is not a survey and not a representative sample: who posts and how much varies enormously by the size and type of a college, and for that reason nothing there is scored, totalled or compared between colleges. Post dates are the model’s own reckoning rather than a retrieved field, so treat them as inside the window and not as exact. Each quotation links to its thread.
What this college is like compares each measure against four-year colleges, because medians differ too much between sectors for a national comparison to describe anything but the sector. A position of “higher than 90%” means the college matches or beats nine in ten of them on that measure, which is why the measured figure is printed beside it. Six of those measures have a better end and carry a mark; the rest are positions with no better end and carry none. There is no overall score, because combining them would need weights and the weights would be our opinion rather than a measurement.
Sources. IPEDS, the Department of Education’s annual survey, except where stated. Each block in the column beside shows its own year, because the underlying files are released on different schedules and a single date across all of them would be false. Published tuition is a sticker price and is never used as a cost; net price is. Test scores are the middle 50% of enrolled students who submitted a score, not of admitted applicants, which is why they differ from the figures other guides print. Where a US News rank is shown it is the current edition, published as a fact about the college rather than an endorsement of the ranking.
The photograph at the top of this page was taken by a member of the public and published under a license that permits reuse with credit. It is not supplied by the college, is not endorsed by it, and shows one building on one day rather than the campus as a whole. We do not generate campus images or buy stock photographs of real places, because a picture of a campus that is not that campus is a lie about somewhere real. Full credit: “Stanford MainQuad.JPG”, Victor Gane / Vgane, via Wikimedia Commons. CC BY-SA 3.0. Source: https://commons.wikimedia.org/wiki/File:Stanford_MainQuad.JPG. License/status: https://creativecommons.org/licenses/by-sa/3.0/.