College Sonar
Compare collegesHow it worksFor colleges

Loading

Explore

Look up a collegeDegrees near youCompare collegesTop degrees by stateWhat colleges are like

Understand

How it worksHow badges are awarded

About

For collegesContact us

College Sonar by Optivara © 2026

University of Michigan-Ann Arbor

Ann Arbor, MI

Photo: w_lemay · CC BY-SA 2.0

Selective · 56 of 59 programs pay back

34,441 undergraduates, 11 students for every faculty member · Division I-FBS athletics

What this college is like

Best Financial Gain

Estimated over 20 years

$1.70M

Computer and Information Sciences General

Worst Financial Gain

Estimated over 20 years

-$92k

Rhetoric and Composition/Writing Studies

Customize by family incomeUnder $30k$30k to $48k$48k to $75k$75k to $110kOver $110k
Program20 yr Financial Gain
  1. 1Computer and Information Sciences General$172,904 annual earnings 4 years after graduation, a median across 665 graduates$1.70M
  2. 2Computer Software and Media Applications$162,114 annual earnings 4 years after graduation, a median across 45 graduates$1.55M
  3. 3Business Administration Management and Operations$144,654 annual earnings 4 years after graduation, a median across 551 graduates$1.31M
  4. 4Computer Engineering$142,071 annual earnings 4 years after graduation, a median across 84 graduates$1.27M
  5. 5Information Science/Studies$130,798 annual earnings 4 years after graduation, a median across 129 graduates$1.12M
  6. 6Multi/Interdisciplinary Studies Other$128,291 annual earnings 4 years after graduation, a median across 27 graduates$1.08M
  7. 7Industrial Engineering$117,930 annual earnings 4 years after graduation, a median across 164 graduates$937k
  8. 8Electrical Electronics and Communications Engineering$117,610 annual earnings 4 years after graduation, a median across 89 graduates$933k
  9. 9Aerospace Aeronautical and Astronautical/Space Engineering$115,075 annual earnings 4 years after graduation, a median across 113 graduates$897k
  10. 10Economics$110,552 annual earnings 4 years after graduation, a median across 391 graduates$835k
View all 59 programs →
  1. 11Statistics$109,466 annual earnings 4 years after graduation, a median across 36 graduates$820k
  2. 12Chemical Engineering$109,405 annual earnings 4 years after graduation, a median across 133 graduates$819k
  3. 13Mathematics$109,146 annual earnings 4 years after graduation, a median across 85 graduates$815k
  4. 14Mechanical Engineering$105,888 annual earnings 4 years after graduation, a median across 292 graduates$770k
  5. 15Biomedical/Medical Engineering$102,342 annual earnings 4 years after graduation, a median across 72 graduates$721k
  6. 16Human Resources Management and Services$99,594 annual earnings 4 years after graduation, a median across 42 graduates$683k
  7. 17Materials Engineering$98,879 annual earnings 4 years after graduation, a median across 32 graduates$673k
  8. 18Naval Architecture and Marine Engineering$94,569 annual earnings 4 years after graduation, a median across 21 graduates$613k
  9. 19Nuclear Engineering$94,330 annual earnings 4 years after graduation, a median across 24 graduates$610k
  10. 20Physics$92,293 annual earnings 4 years after graduation, a median across 35 graduates$582k
  11. 21Civil Engineering$89,165 annual earnings 4 years after graduation, a median across 63 graduates$538k
  12. 22Environmental/Environmental Health Engineering$84,973 annual earnings 4 years after graduation, a median across 29 graduates$480k
  13. 23Registered Nursing Nursing Administration Nursing Research and Clinical Nursing$82,265 annual earnings 4 years after graduation, a median across 175 graduates$442k
  14. 24Communication and Media Studies$79,648 annual earnings 4 years after graduation, a median across 231 graduates$406k
  15. 25Sports Kinesiology and Physical Education/Fitness$79,411 annual earnings 4 years after graduation, a median across 181 graduates$403k
  16. 26Cognitive Science$79,016 annual earnings 4 years after graduation, a median across 46 graduates$397k
  17. 27Public Health$78,928 annual earnings 4 years after graduation, a median across 33 graduates$396k
  18. 28Political Science and Government$77,480 annual earnings 4 years after graduation, a median across 267 graduates$376k
  19. 29Public Policy Analysis$73,749 annual earnings 4 years after graduation, a median across 57 graduates$324k
  20. 30International/Globalization Studies$72,545 annual earnings 4 years after graduation, a median across 189 graduates$308k
  21. 31Germanic Languages Literatures and Linguistics$68,898 annual earnings 4 years after graduation, a median across 33 graduates$257k
  22. 32Cell/Cellular Biology and Anatomical Sciences$68,042 annual earnings 4 years after graduation, a median across 38 graduates$245k
  23. 33Biochemistry Biophysics and Molecular Biology$67,925 annual earnings 4 years after graduation, a median across 82 graduates$244k
  24. 34Liberal Arts and Sciences General Studies and Humanities$67,859 annual earnings 4 years after graduation, a median across 47 graduates$243k
  25. 35Research and Experimental Psychology$67,537 annual earnings 4 years after graduation, a median across 463 graduates$238k
  26. 36Philosophy$67,293 annual earnings 4 years after graduation, a median across 35 graduates$235k
  27. 37Fine and Studio Arts$66,846 annual earnings 4 years after graduation, a median across 131 graduates$229k
  28. 38Natural Resources Conservation and Research$65,714 annual earnings 4 years after graduation, a median across 114 graduates$213k
  29. 39Chemistry$65,591 annual earnings 4 years after graduation, a median across 20 graduates$211k
  30. 40Architecture$65,015 annual earnings 4 years after graduation, a median across 52 graduates$203k
  31. 41Romance Languages Literatures and Linguistics$64,426 annual earnings 4 years after graduation, a median across 103 graduates$195k
  32. 42Ethnic Cultural Minority Gender and Group Studies$63,426 annual earnings 4 years after graduation, a median across 60 graduates$181k
  33. 43Sociology$63,419 annual earnings 4 years after graduation, a median across 94 graduates$181k
  34. 44History$62,077 annual earnings 4 years after graduation, a median across 93 graduates$163k
  35. 45Biology General$61,127 annual earnings 4 years after graduation, a median across 59 graduates$149k
  36. 46Geological and Earth Sciences/Geosciences$60,949 annual earnings 4 years after graduation, a median across 34 graduates$147k
  37. 47Dental Support Services and Allied Professions$59,402 annual earnings 4 years after graduation, a median across 65 graduates$125k
  38. 48Area Studies$58,232 annual earnings 4 years after graduation, a median across 46 graduates$109k
  39. 49Microbiological Sciences and Immunology$57,890 annual earnings 4 years after graduation, a median across 27 graduates$105k
  40. 50English Language and Literature General$57,809 annual earnings 4 years after graduation, a median across 122 graduates$103k
  41. 51Film/Video and Photographic Arts$57,059 annual earnings 4 years after graduation, a median across 80 graduates$93k
  42. 52Neurobiology and Neurosciences$55,436 annual earnings 4 years after graduation, a median across 69 graduates$70k
  43. 53Linguistic Comparative and Related Language Studies and Services$55,137 annual earnings 4 years after graduation, a median across 33 graduates$66k
  44. 54Teacher Education and Professional Development Specific Levels and Methods$54,558 annual earnings 4 years after graduation, a median across 52 graduates$58k
  45. 55Anthropology$53,042 annual earnings 4 years after graduation, a median across 62 graduates$37k
  46. 56Ecology Evolution Systematics and Population Biology$52,390 annual earnings 4 years after graduation, a median across 36 graduates$28k
  47. 57Drama/Theatre Arts and Stagecraft$45,888 annual earnings 4 years after graduation, a median across 68 graduates-$62k
  48. 58Music$43,777 annual earnings 4 years after graduation, a median across 83 graduates-$91k
  49. 59Rhetoric and Composition/Writing Studies$43,689 annual earnings 4 years after graduation, a median across 25 graduates-$92k

This college's programs pay very differently from one another, so any single figure for the college as a whole would hide more than it shows.

Other colleges to consider

Every college here returns more than this one’s best program, within 250 miles. Nothing within 50 miles returns more, so the search was widened to 250 miles rather than showing you almost nothing.

Colleges of comparable difficulty come first here. Any that admit far fewer applicants than this one sit below them and are marked with what they admit. A more selective college is a different application, not a free upgrade, and part of why its graduates earn more is who it admitted in the first place.
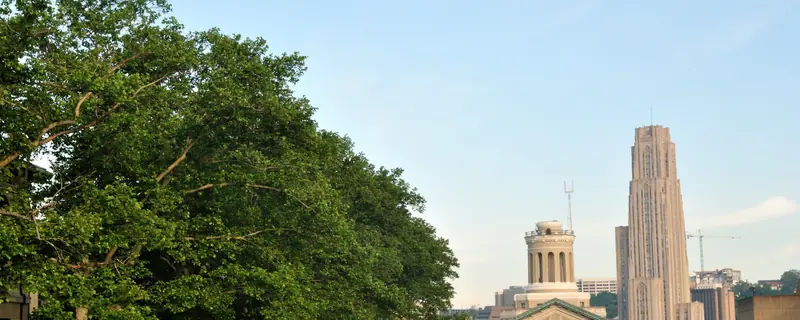
  1. 1The Mall Carnegie MellonCarnegie Mellon UniversityComputer Science · Pittsburgh · 234 mi · $268,121 annual earnings 4 years after graduation, a median across 121 graduates$2.91M

Campus photograph: Carnegie Mellon University by Asamudra (CC BY 3.0)

Harder to get into than this college, by the same measure
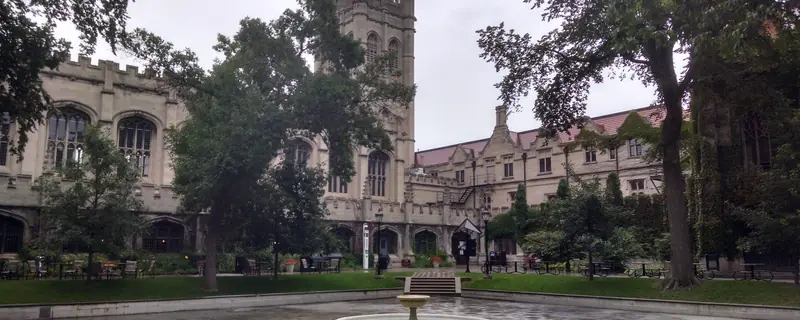
  1. 2University of Chicago main quadranglesUniversity of ChicagoComputer Science · Chicago · 201 mi · $178,068 annual earnings 4 years after graduation, a median across 32 graduatesadmits 4%$1.74M

Campus photograph: University of Chicago by Ndshankar (CC BY-SA 4.0)

The same programs elsewhere

Holding the subject fixed and changing the college, for this college’s three strongest programs. The list above compares whole colleges at their best; this one answers the narrower question a student who already knows their subject is actually asking.

Computer and Information Sciences General6 colleges pay more
  1. 1The Mall Carnegie MellonCarnegie Mellon UniversityPittsburgh · 234 mi · $187,437 annual earnings 4 years after graduation, a median across 43 graduates$1.78M

Campus photograph: Carnegie Mellon University by Asamudra (CC BY 3.0)

Business Administration Management and Operations1 college pays more
  1. 1The Mall Carnegie MellonCarnegie Mellon UniversityPittsburgh · 234 mi · $160,783 annual earnings 4 years after graduation, a median across 119 graduates$1.41M

Campus photograph: Carnegie Mellon University by Asamudra (CC BY 3.0)

What this college is like

Measured from federal filings, not from a survey. Each figure is compared against four-year colleges, because medians differ too much between sectors for a national comparison to describe anything but the sector.

Teaching
Students per instructor?
11:1
▲fewer students per instructor than 75% of four-year colleges
Staying and finishing
Come back after year one?
97%
▲higher than 97% of four-year colleges
Finish their credential?
82%
▲higher than 97% of four-year colleges
Cost and aid
Yearly cost, family under $30,000?
$4,692
▲cheaper than 93% of four-year colleges
Get a grant from the college?
58%
▼a lower share than 79% of four-year colleges
Receive a Pell Grant?
20%
a lower share than 86% of four-year colleges
The campus
Undergraduates?
34,441
larger than 98% of four-year colleges
Beds per 100 undergraduates?
34
fewer than 77% of four-year colleges
Study fully online?
0.1%
fewer than 80% of four-year colleges
Graduate students, share of enrollment?
29%
more than 80% of four-year colleges
Play a varsity sport?
2.8%
fewer than 91% of four-year colleges
Who else is there
Mix of student backgrounds?
72 of 100
more varied than 81% of four-year colleges
Choice of subject
Broad subject areas awarded?
25
▲more than 91% of four-year colleges
Also on record
Women and men
54% / 46%
reported, not ranked
Setting
City
reported, not ranked
On-campus housing
Yes
residential
Athletic division
NCAA Division I-FBS
reported, not ranked

Compare every college in this metro

What students are saying

Students and recent alumni of University of Michigan-Ann Arbor, in their own words, on Reddit. Every quotation links to the thread it came from.

What came up most

several threads · August to October 2026
NegativeThe proposed high-performance computing facility/data-center project and its effects on the Ypsilanti-area community were discussed repeatedly, mostly negatively.
Respectfully, UM Public Relations needs to stop worrying about what euphemism they use for “data center”: Ypsi knows damn well what it is, and sees perfectly clearly that you chose to drop it in their backyard instead of your own.
r/uofm
MixedTransfer admission, affordability, and whether Michigan is worth changing schools for were recurring topics, with mixed views.
I had two years from LCC with a 3.95 GPA, transferred to MSU and got a 4.0 for one semester then got accepted to LSA at UMich Ann Arbor.
r/uofm
MixedUndergraduate academic-policy changes, including first-term grading and computer-science enrollment rules, prompted mixed debate.
100% moving towards a participation award. You’re an adult now. Accept failure and learn from your mistakes. Also, further degrades the value of your own degree.
r/uofm

What students said they valued

several threads · November to October 2026
PositiveA recent alumn valued the degree's name recognition and its practical help in job interviews.
Since graduating from the University of Michigan, it has come up in every job interview I’ve had. Employers were always impressed by the school, and it often helped me get the job.
r/uofm
PositiveA current Data Science senior praised Michigan's combined academic, athletic, social, and alumni-network experience.
Current Data Science senior here - There isn't a better school in the world to provide someone with the optimal college experience. No one does academics, sports, social, and alum network better than U of M.
r/uofm
PositiveAn engineering student valued accessible, supportive ways to get research and project experience.
I think umich makes it really easy to become a part of a program/project (at least from the engineering perspective) with little to no experience, and the environments are incredibly supportive.
r/uofm
PositiveA transfer student liked Ann Arbor's active college-town atmosphere relative to a commuter-school campus.
Really like the college town vibe. I went to a commuter school and the campus at my old school was pretty dead apart from the people I saw coming and going from classes.
r/uofm
PositiveA former student valued how the campus is integrated with downtown Ann Arbor and its architecture.
U-M is designed to be integrated into the city, so you don’t quite know where the school begins and where it ends.
r/uofm
PositiveA former student valued the range of student organizations and free performing-arts access.
I love that U-M has so many student organizations! I really enjoyed going to Fesitfall when I was a student here and checking out what kind of student orgs we had.
r/uofm
PositiveA Political Science alumn valued career-oriented clubs, connections, internships, and the alumni network.
The program here gives you many opportunities to join clubs, make connections, and find internships that will actually benefit your career. One big benefit U-M has that other universities don’t is its massive alumni network, which personally helped me a lot when looking for internships.
r/uofm
PositiveA recent Political Science alumn valued the plausibility of ambitious internship outcomes for Michigan students and graduates.
These are not unreasonable outcomes for a umich student/grad, and have been done many many times.
r/uofm

What students criticized

several threads · November to October 2026
NegativeA senior criticized faculty for failing to publish course sites, syllabi, or other information before the term began.
not a single one of the FIVE CLASSES I am enrolled in have published their fucking Canvas site or sent out any form of communication.
r/uofm
NegativeA first-year student criticized how transferred credits unexpectedly changed their financial-aid situation and left them owing money.
it was not communicated to me before that transferring my credits would effect my financial aid
r/uofm
NegativeStudents complained about Ann Arbor housing costs, distance from campus, poor-quality options, and annual-lease/subletting requirements.
once you find one you basically decide between being far from campus, paying an egregious amount in rent, or just living somewhere shitty.
r/uofm
NegativeA student criticized EECS 482 as unfair and poorly designed, citing ambiguous project specifications and inadequate instructional support.
If you care about your time, mental stability, and or fairness do not take this class.
r/uofm
NegativeA rising senior criticized the town, social environment, resource availability, competitiveness, rent, fees, and racial climate, saying these contributed to wanting to transfer.
i hate the town and the people, just the lack of resources and competitiveness, the outrageous rent prices, the hidden fees, i just don't feel comfortable especially because it's a pwi
r/uofm
NegativeAn out-of-state student complained that a large tuition increase and scholarship reduction made attendance unaffordable.
Genuinely don’t know what to do because I can’t afford a 16k increase in tuition.
r/uofm

Compare University of Michigan-Ann Arbor with another college · up to four side by side, on return and on what each place is like.

27,199Average annual costAfter grants · In-state · Family income Over $110k
93%Finish within six years
34,441Undergraduates
16%Applicants admitted

Where students come from

  • Michiganin state52%
  • New York6%
  • Illinois6%
  • California5%
  • Outside the US4%

Share of the 7,278 students who entered as first-year undergraduates in 2024. The states shown are the three largest outside Michigan, so these do not add to 100%.

At a glance
SettingCity
Undergraduates?34,441
Graduate students14,057
Accepts16%
U.S. News national?#25
Admitted students who enroll?47%
WebsiteVisit umich.edu
AdmissionsAY2024
Applicants98,310
Admitted15,373
Enrolled7,278
SAT middle 50%?1360-1530
ACT middle 50%31-34
Test scores?considered but not required
CostAY2022
Published price, out of state?$60,107
Published price, in state?$18,309
Room and board$13,856
Full year’s cost after grants, by income, in state
Under $30k$4,692
$30k-$48k$6,904
$48k-$75k$12,432
$75k-$110k$18,938
Over $110k$27,199

These are in-state figures. A public college charges more to students from other states, and no out-of-state net price is published, so if you would not be a resident here, read the published prices above for the size of the difference.

Aid · AY2023
Average grant?$21,722 to 58%
Pell students?20%
Federal loan debt · October 2026
Students who borrow?24%
Owed at graduation?$18,515
Monthly, over 10 years?$210/mo
Owed if they leave early?$9,217
Outcomes2018 cohort
Graduate in 4 years82%
Graduate in 6 years93%
Return after year 1?97%
Students per faculty11:1
Most-awarded programs, bachelor'sAY2025
Computer and Information Sciences General1,216 degrees
Research and Experimental Psychology734 degrees
Business Administration Management and Operations635 degrees
Economics608 degrees
Biology General350 degrees
AthleticsAY2024
DivisionNCAA Division I-FBS
Athletes910
Share of undergraduates?3%
Athletic aid$31,170,894
StudentsAY2024
Women / men54% / 46%
White46%
Asian18%
Hispanic12%
International8%
Two or more6%
Black5%

Notes and sources

Total gain after 20 years is what a graduate is ahead at that point: what the degree pays above a high-school graduate in the same state, less four years of net price and the wages given up while studying, weighted by the share of students who finish. At this college that share is 93%, and it is the same for every program on this page because the federal data reports completion for the institution rather than for individual programs. Four-year and open-admission colleges are ranked separately and never pooled.

Annual earnings 4 years after graduation is the median earnings of that program’s graduates at that point, for students who received federal aid, and is published by program. There is no program-level cost anywhere in the federal data, so net price is the college’s figure applied to each program alike. That is sound for ordering programs against one another and should not be read as a precise figure for any one of them.

Cost on this page is always net price, never the published sticker price. Net price is the college’s full cost of attendance for a year, meaning tuition, required fees, books and supplies, and housing and food, with grant and scholarship aid from federal, state and institutional sources subtracted. Loans are not subtracted, because a loan is not a discount. It is an average for first-time full-time undergraduates receiving federal aid, reported by the college in the income bands shown, so it describes a typical family in that band rather than any particular one. A student living at home, paying out-of-state rates or holding an outside scholarship will not see this figure.

Federal loan debt comes from the College Scorecard and is a median among students who borrowed, not an average across everyone. A college where few students take loans can show a high figure and a small bill for most families, so the share who borrow is printed above it and neither should be read without the other. It counts federal student loans only: private loans and Parent PLUS borrowing are not in it and are not published anywhere comparable, which makes this a floor on what a family owes rather than a total. The figure for students who leave without finishing is the same loans without the degree they were taken for. Default rates are deliberately absent: federal repayment was suspended, so the published three-year rate is zero at almost every college in the country and says nothing about any of them.

Most-awarded programs are degrees conferred in AY2025, first majors only, so a double major counts once. Where two programs are within a few degrees of each other the order between them is not meaningful.

Quotations from students were found by a language model searching Reddit, and selected from threads discussing this college in the window shown beside them. Reddit only, so this is not a survey and not a representative sample: who posts and how much varies enormously by the size and type of a college, and for that reason nothing there is scored, totalled or compared between colleges. Post dates are the model’s own reckoning rather than a retrieved field, so treat them as inside the window and not as exact. Each quotation links to its thread.

What this college is like compares each measure against four-year colleges, because medians differ too much between sectors for a national comparison to describe anything but the sector. A position of “higher than 90%” means the college matches or beats nine in ten of them on that measure, which is why the measured figure is printed beside it. Six of those measures have a better end and carry a mark; the rest are positions with no better end and carry none. There is no overall score, because combining them would need weights and the weights would be our opinion rather than a measurement.

Sources. IPEDS, the Department of Education’s annual survey, except where stated. Each block in the column beside shows its own year, because the underlying files are released on different schedules and a single date across all of them would be false. Published tuition is a sticker price and is never used as a cost; net price is. Test scores are the middle 50% of enrolled students who submitted a score, not of admitted applicants, which is why they differ from the figures other guides print. Where a US News rank is shown it is the current edition, published as a fact about the college rather than an endorsement of the ranking.

The photograph at the top of this page was taken by a member of the public and published under a license that permits reuse with credit. It is not supplied by the college, is not endorsed by it, and shows one building on one day rather than the campus as a whole. We do not generate campus images or buy stock photographs of real places, because a picture of a campus that is not that campus is a lie about somewhere real. Full credit: “Law Quadrangle, University of Michigan, University Avenue and State Street, Ann Arbor, MI - 54381402138.jpg”, w_lemay, via Wikimedia Commons. CC BY-SA 2.0. Source: https://commons.wikimedia.org/wiki/File:Law_Quadrangle,_University_of_Michigan,_University_Avenue_and_State_Street,_Ann_Arbor,_MI_-_54381402138.jpg. License/status: https://creativecommons.org/licenses/by-sa/2.0/.

Full methodology